KPI Lens
KPI Lens is a Next.js application built for development organisations seeking to truly measure the impact of development projects implemented in communities. It is the largest codebase and most complex application I've built to date. It required a lot of moving parts including the workspace manager, project manager, workspace sharing, survey builder, Excel database import, results table, M&E frameworks, indicator query builder and dashboard. Multi-tenancy is applied where each user's workspace has it's own database and requests are isolated as such. It is powered by 3 backend microservices.
Type
Startup MVP
Stack
- Next.js
- TypeScript
- Chakra UI
- Emotion
- Apollo Client
- Redux
- Storybook
- GraphQL
- NestJS
- PostgreSQL
- TypeORM
- NATS
- Redis
- Jest
- Cubejs
- Nx Monorepo
- GCP
- AWS
- Digital Ocean
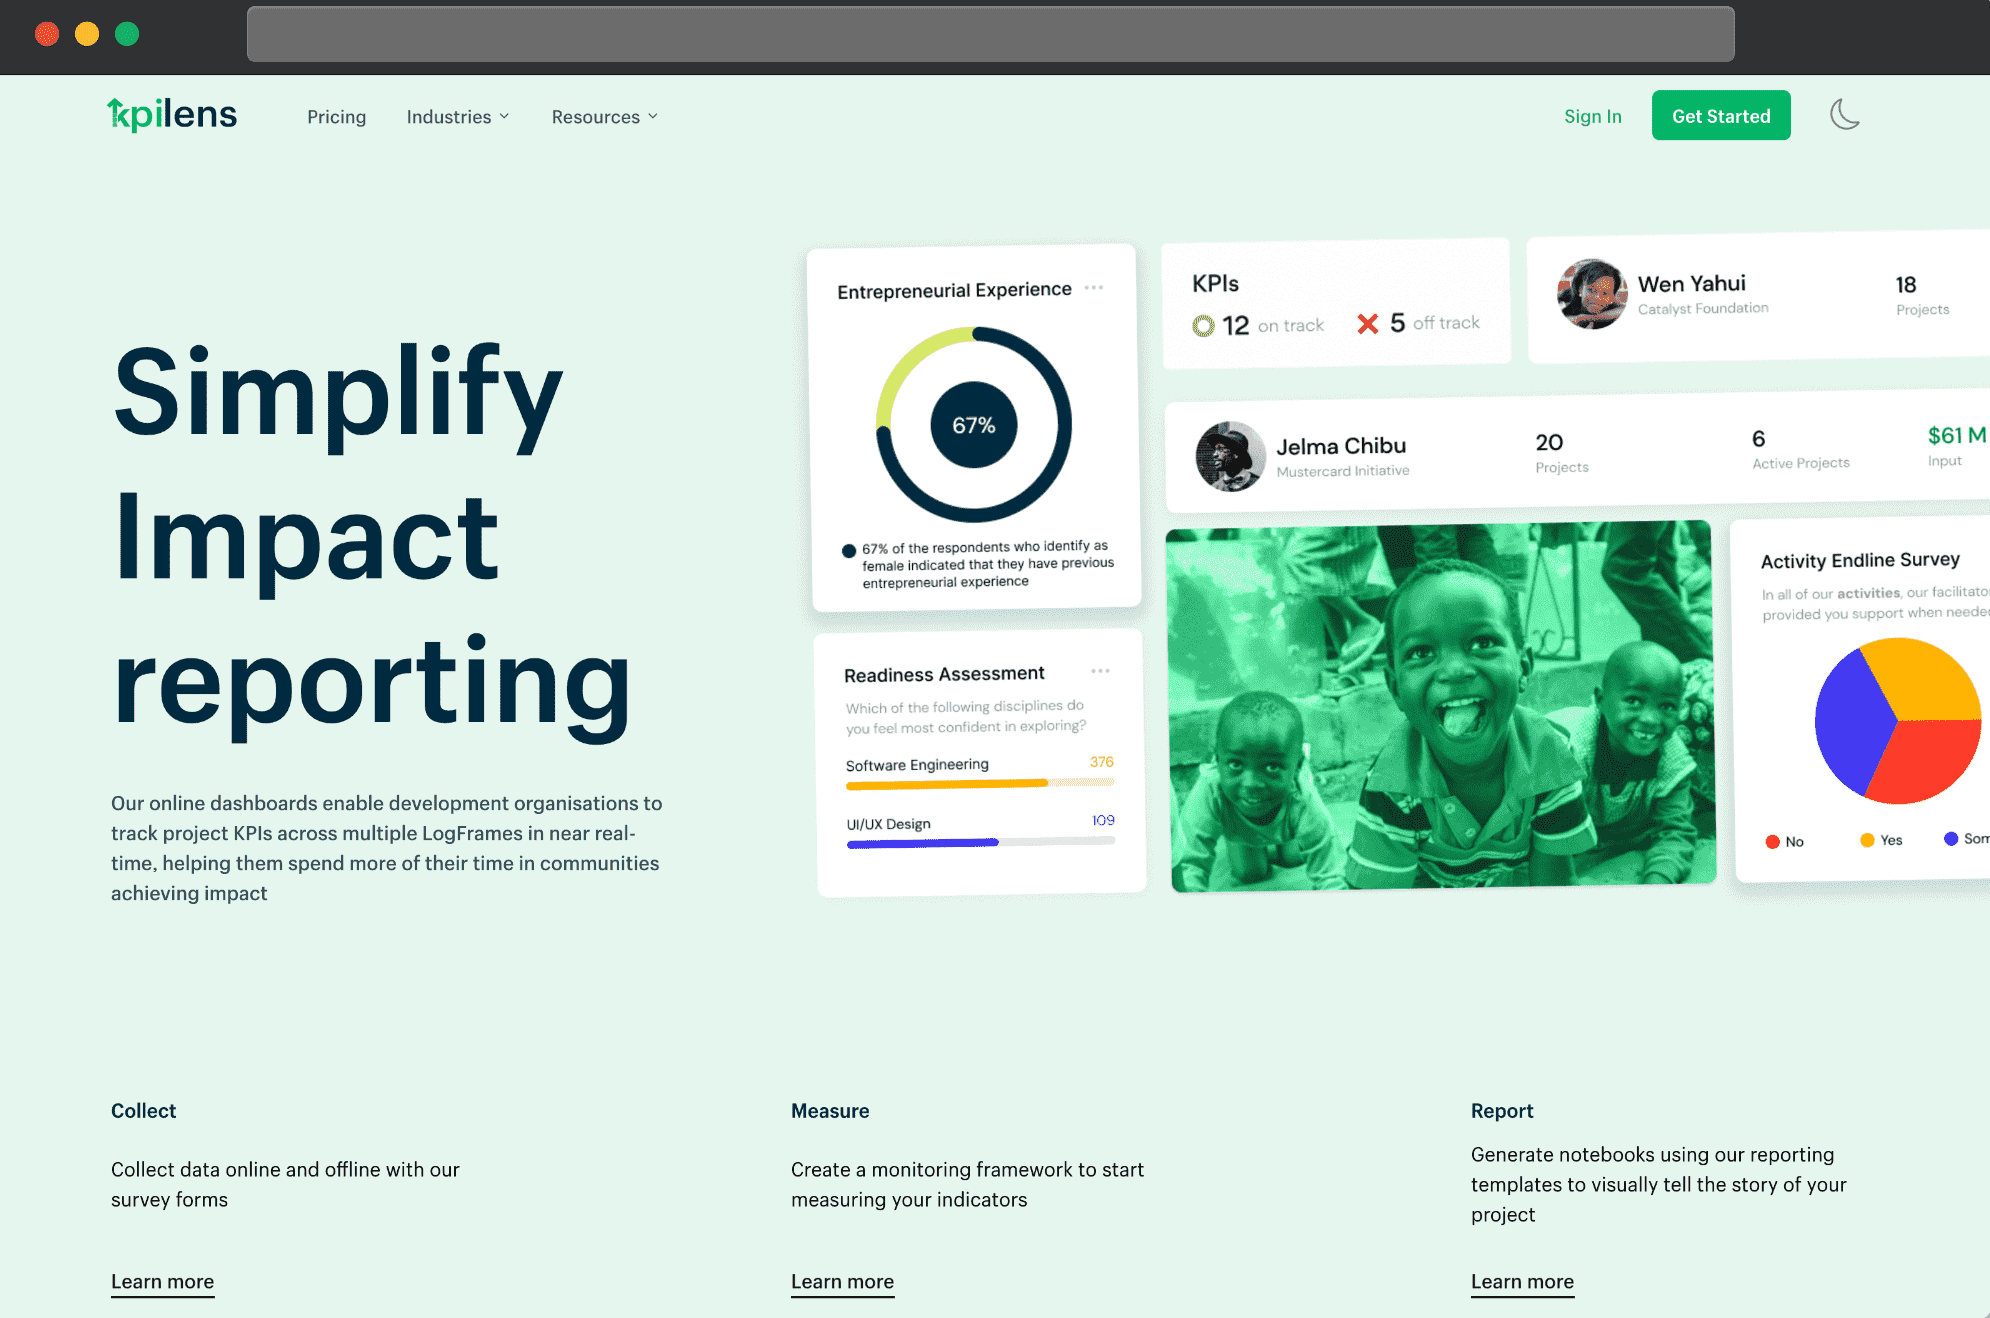
The Key Performance Indicator Dashboard.
The Problem
According to KPMG’s Monitoring and Evaluation (M&E) Survey, 77% of development organizations use Excel-based frameworks and various software tools to process their data. This process is tedious and inefficient; causing delays in decision-making, increased costs, and accountability gaps in the project delivery.
Solution and Features
A cloud-based platform where data from several sources can be gathered, cleaned, analysed and compared to a results framework to generate reports on dashboards that donors can access to see how the project is performing in near-real-time.
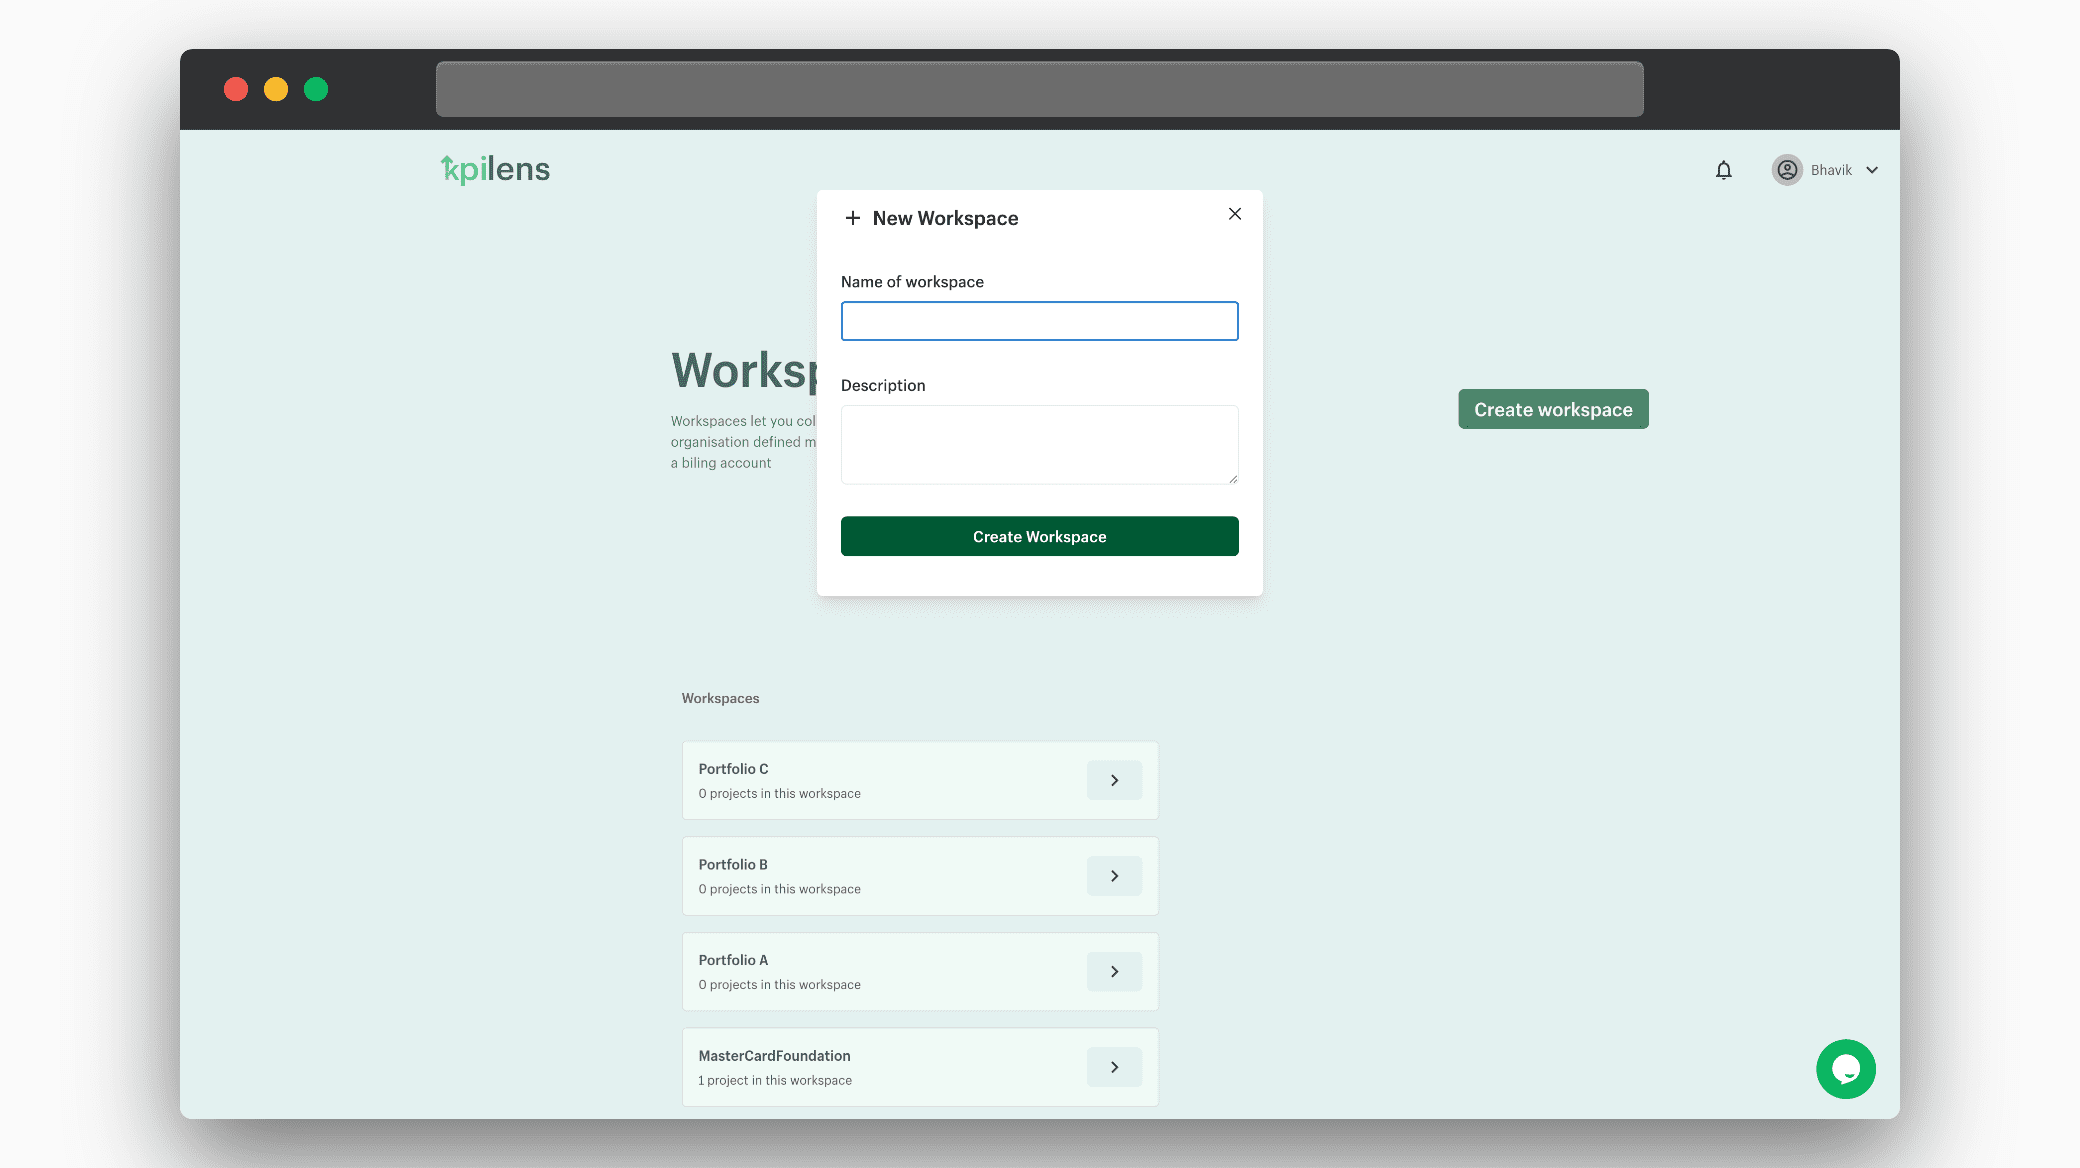
Workspace Manager
The workspace manager enables the user to organise projects into various workspaces that collocate different sets of projects having unique stakeholders or other peculiar characteristics.
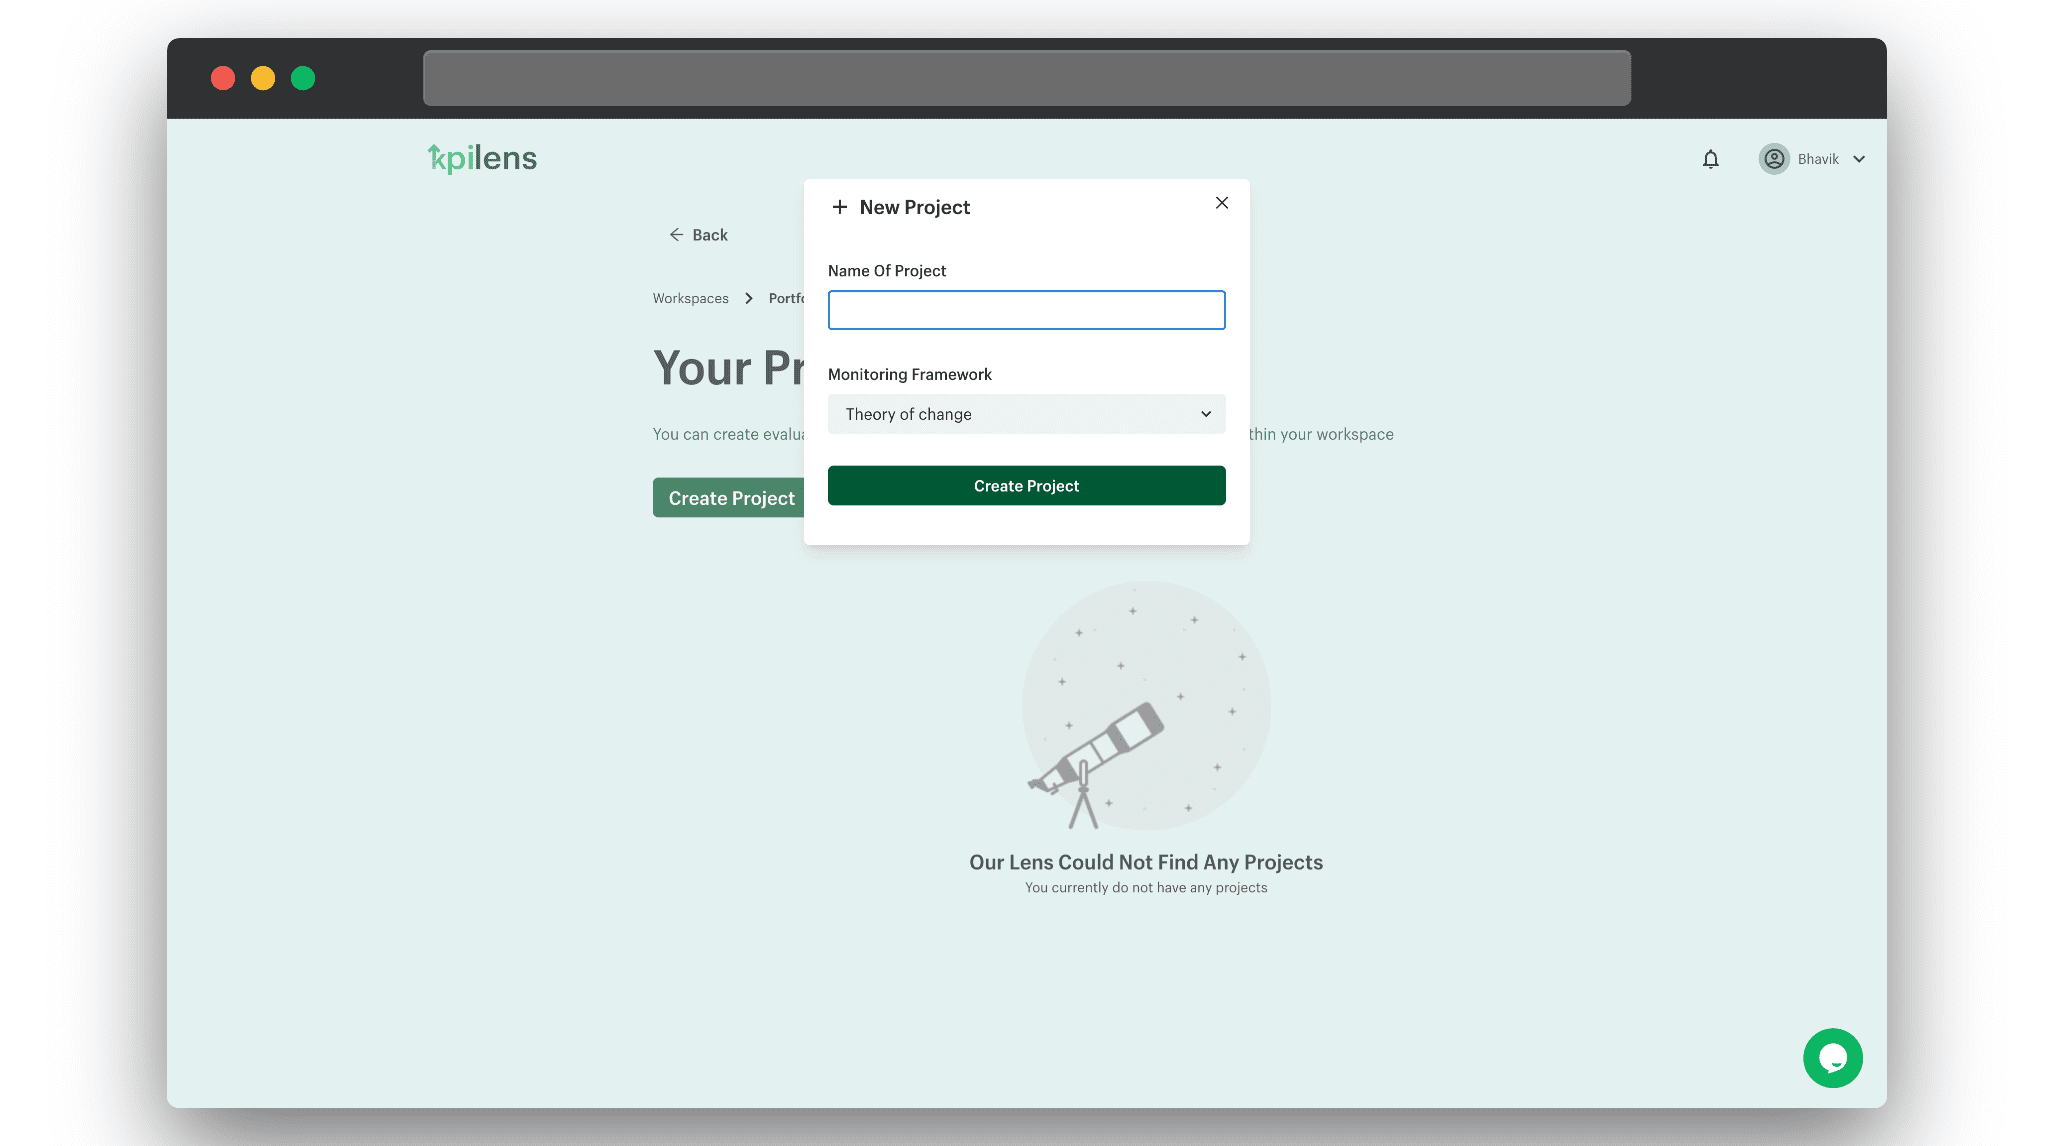
Project Manager
The project manager enables the user to organise related project surveys, indicators, monitoring frameworks, and reports into a single project.
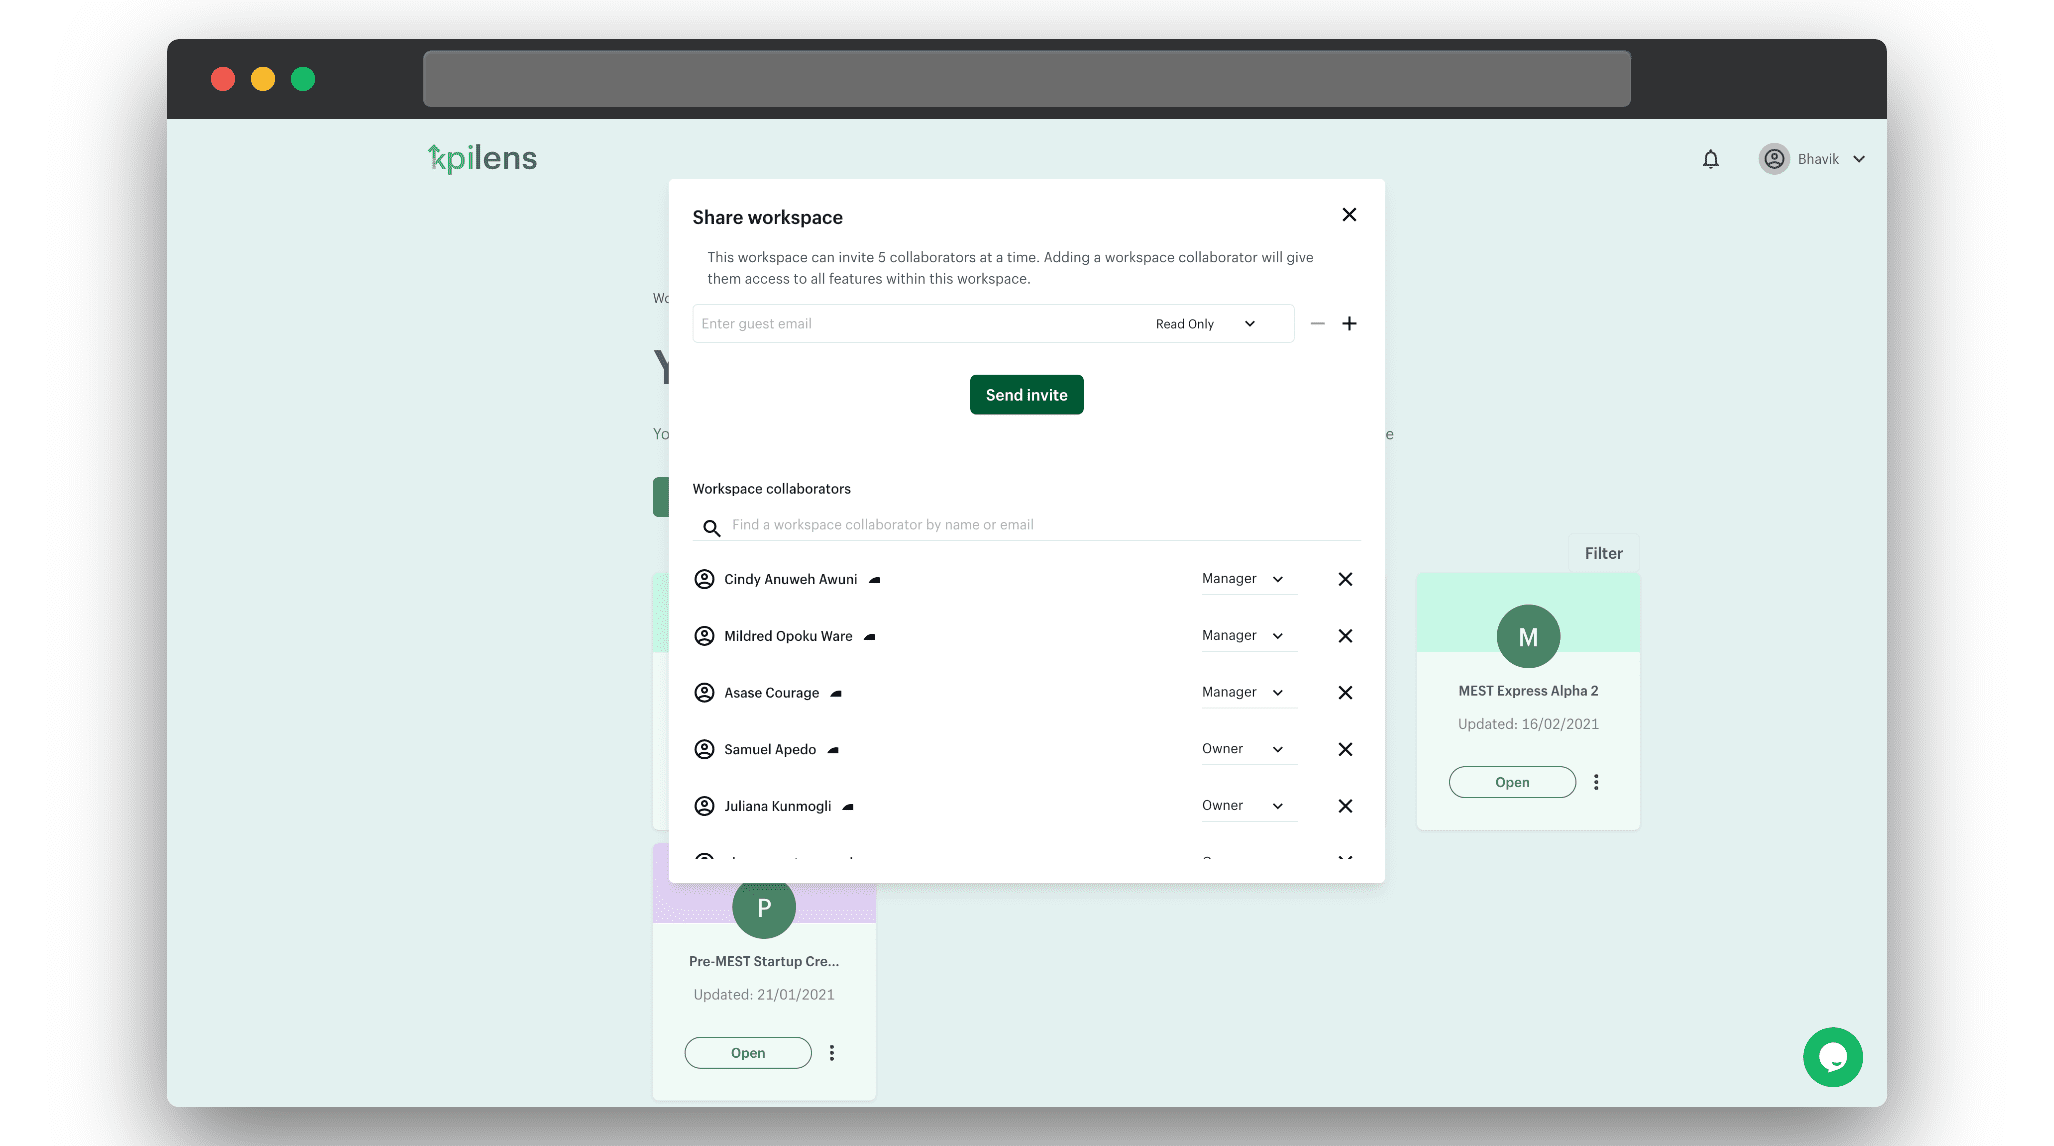
Workspace Sharing
Users can give other users and stakeholders read, write, or other access level permissions to all features within their workspace using the workspace sharing feature. Email invites are sent with access level and permissions pre-configured which could be updated subsequently just like sharing documents in Google docs.
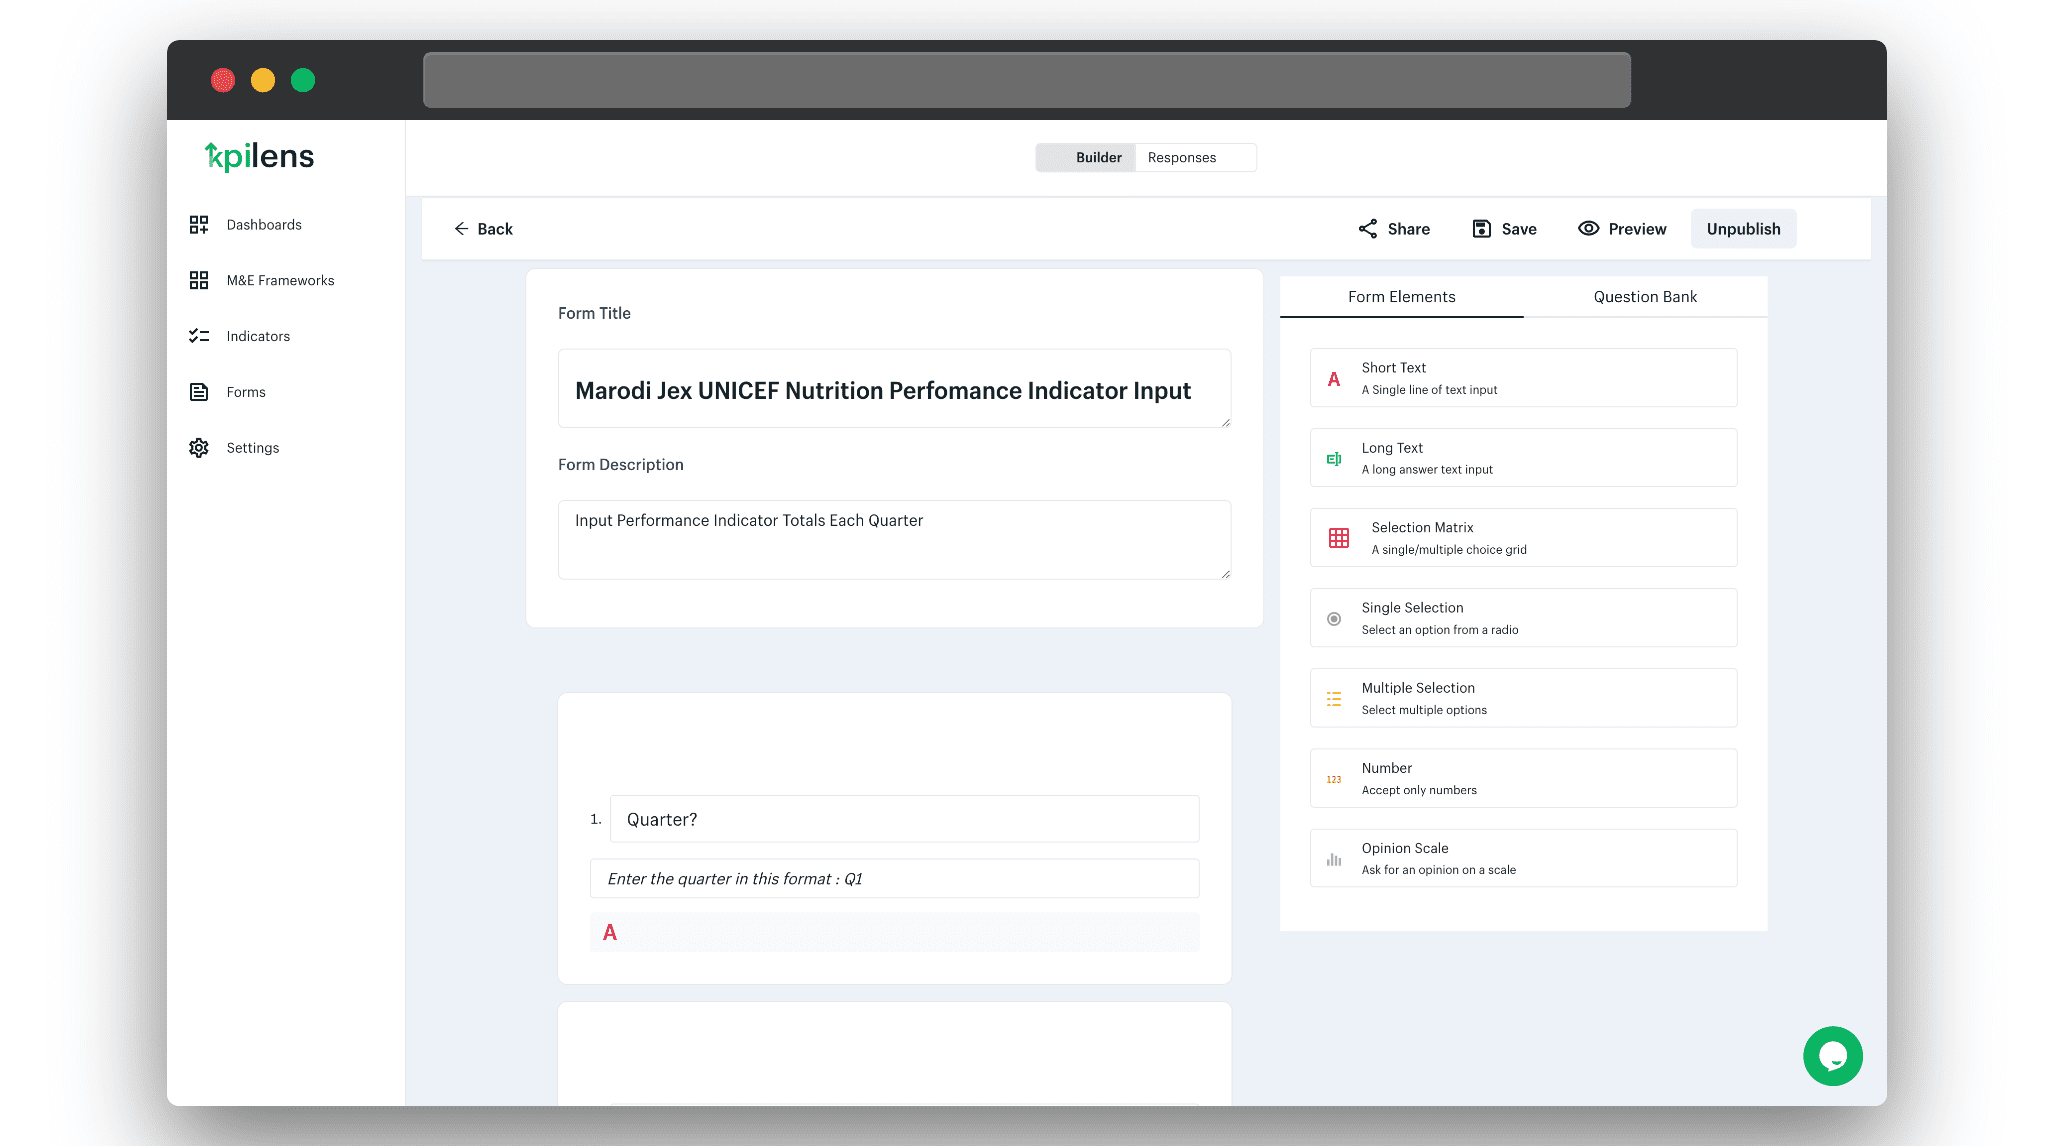
The Survey Builder
The survey builder enables the user to create any type of survey or form for data collection dynamically via a drag-and-drop interface. Form elements are dragged onto the form canvas and validation parameters are configured for each form element. The form is then published and shared with beneficiaries of a project via WhatsApp or email. Form submissions are saved in the database that belongs to the user's workspace.
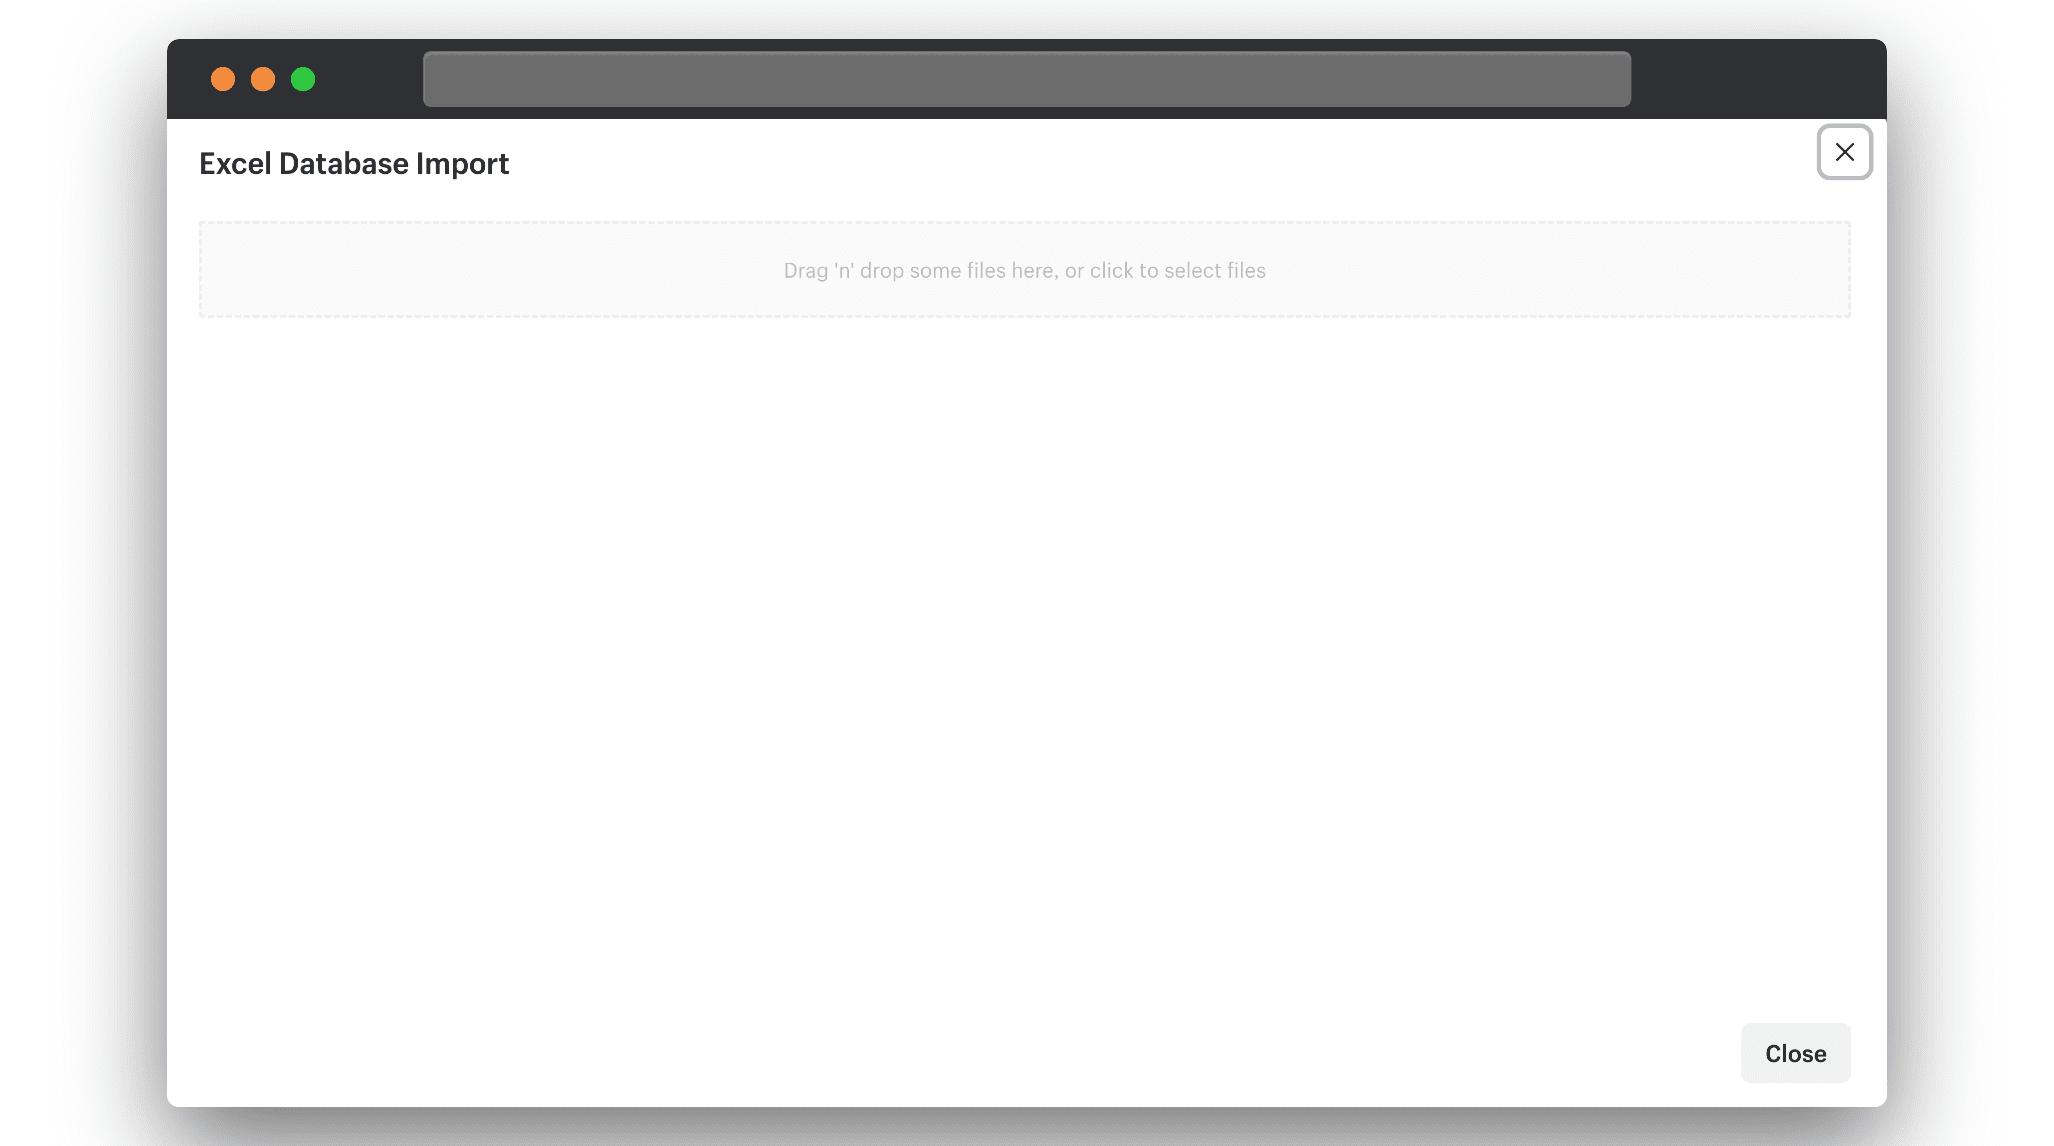
Excel Database Import
For users who already have data in Excel files, the Excel database import enables the user to upload all Excel files into KPI Lens. These Excel files are transformed into KPI Lens surveys, and the data is stored in the workspace database, enabling the user to continue collecting data with KPI Lens from where they left off with the previous tool they used. This feature provides a frictionless onboarding process for new users.
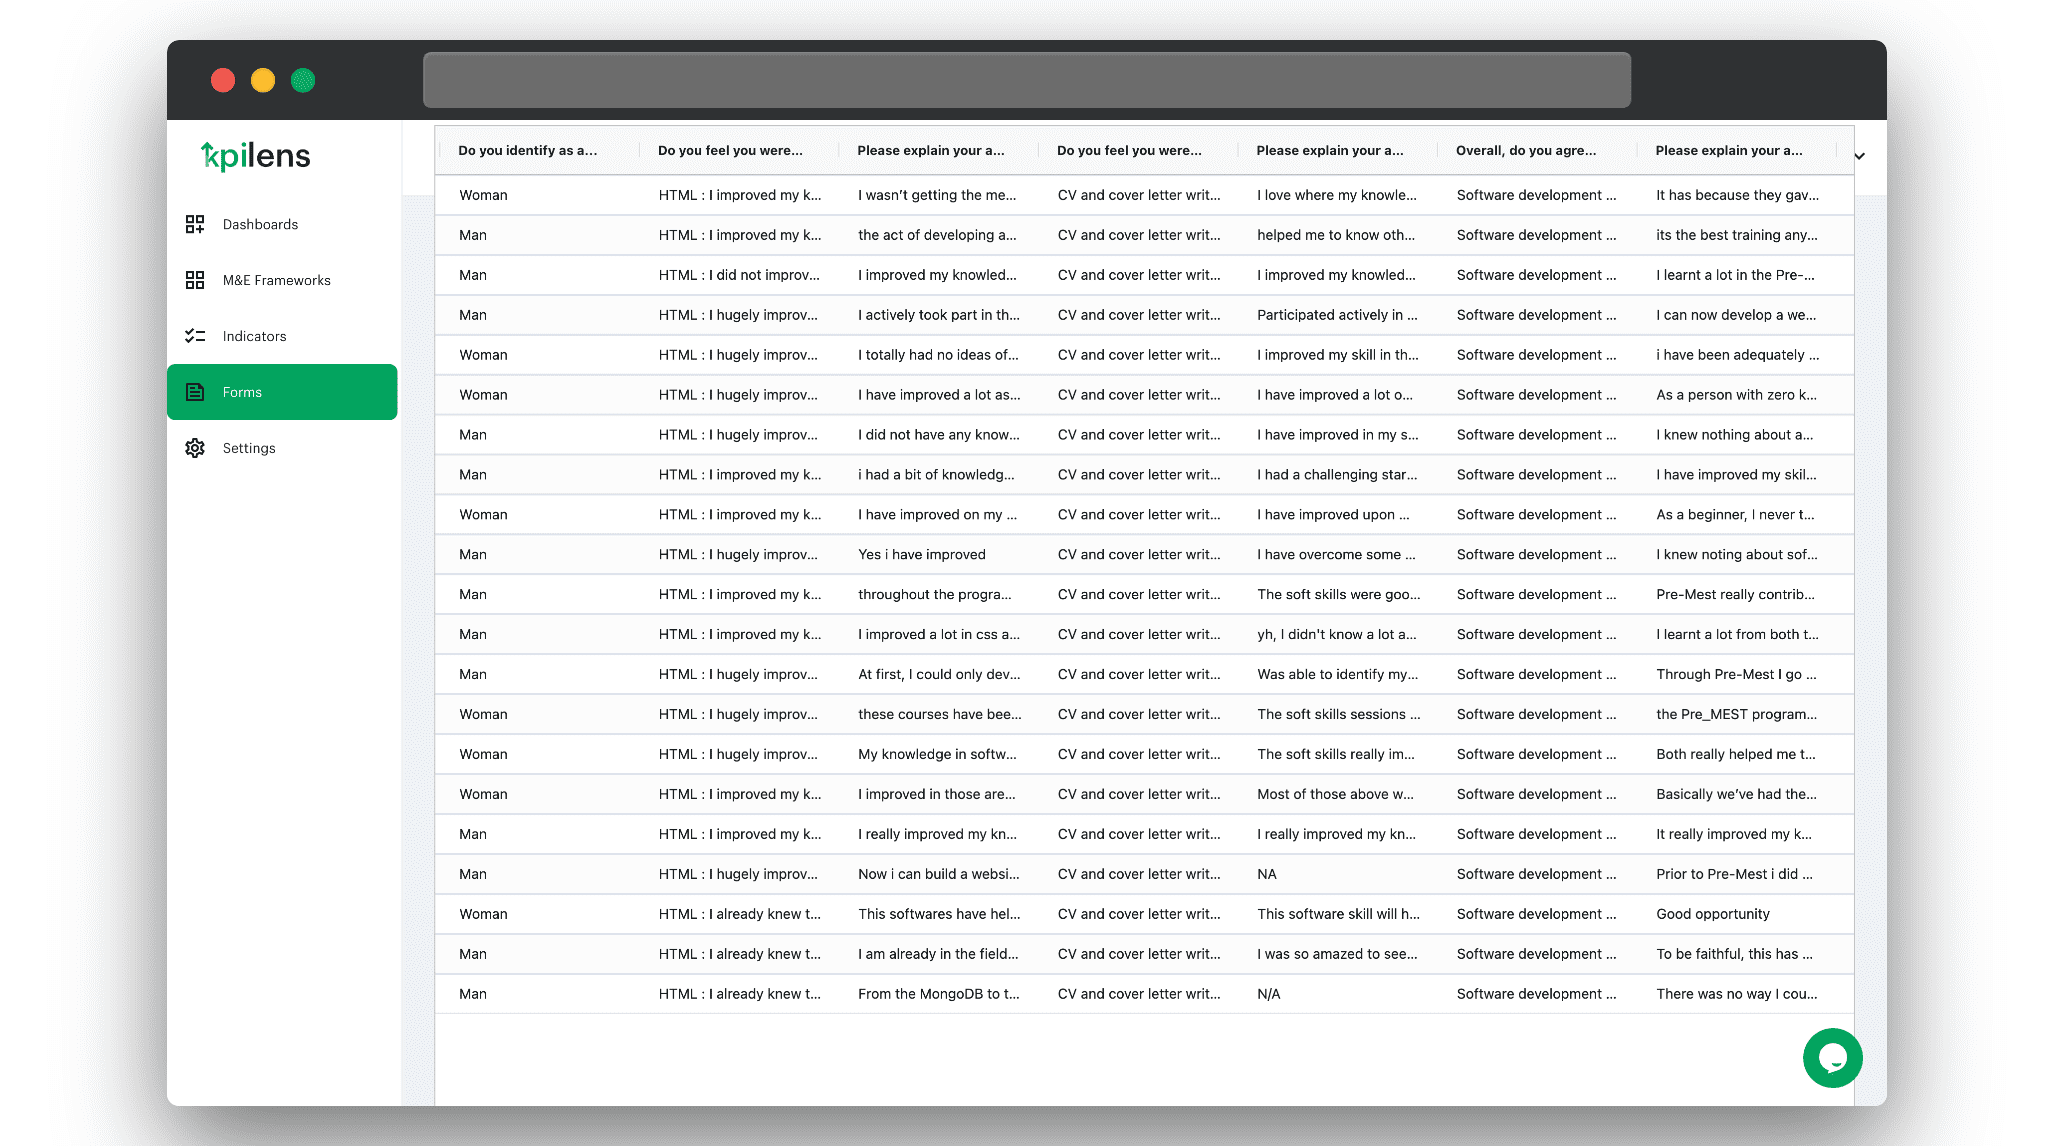
Results Table
Data collected with the survey builder, and Excel database import can be accessed in a tabular format. Basic functionality such as searching, sorting, and filtering can be performed on the data. The data table can also be exported as an Excel or CSV file.
M&E Frameworks
Users can create a Logical Framework or Theory of Change for each project using the M&E Frameworks feature to organise and manage project indicators.
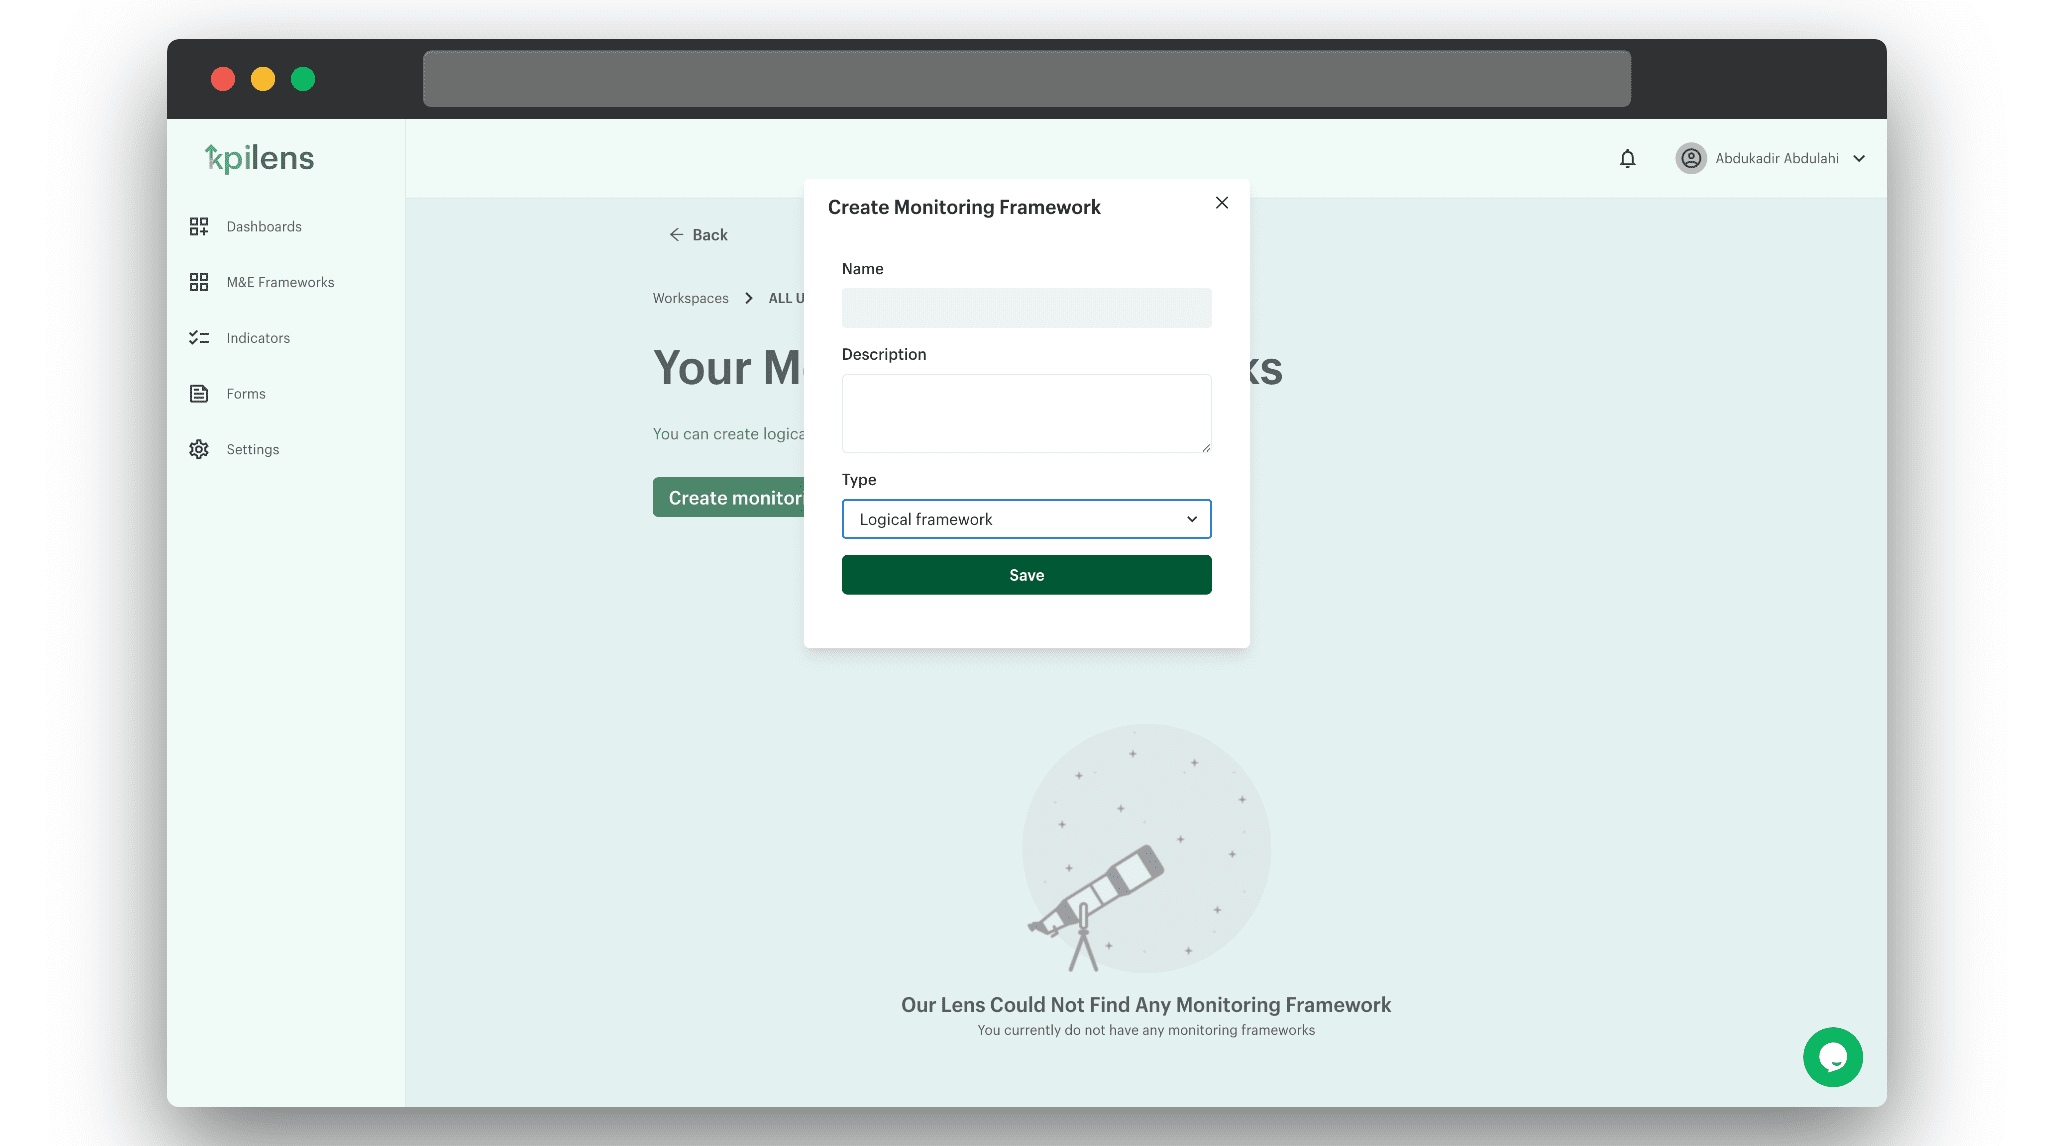
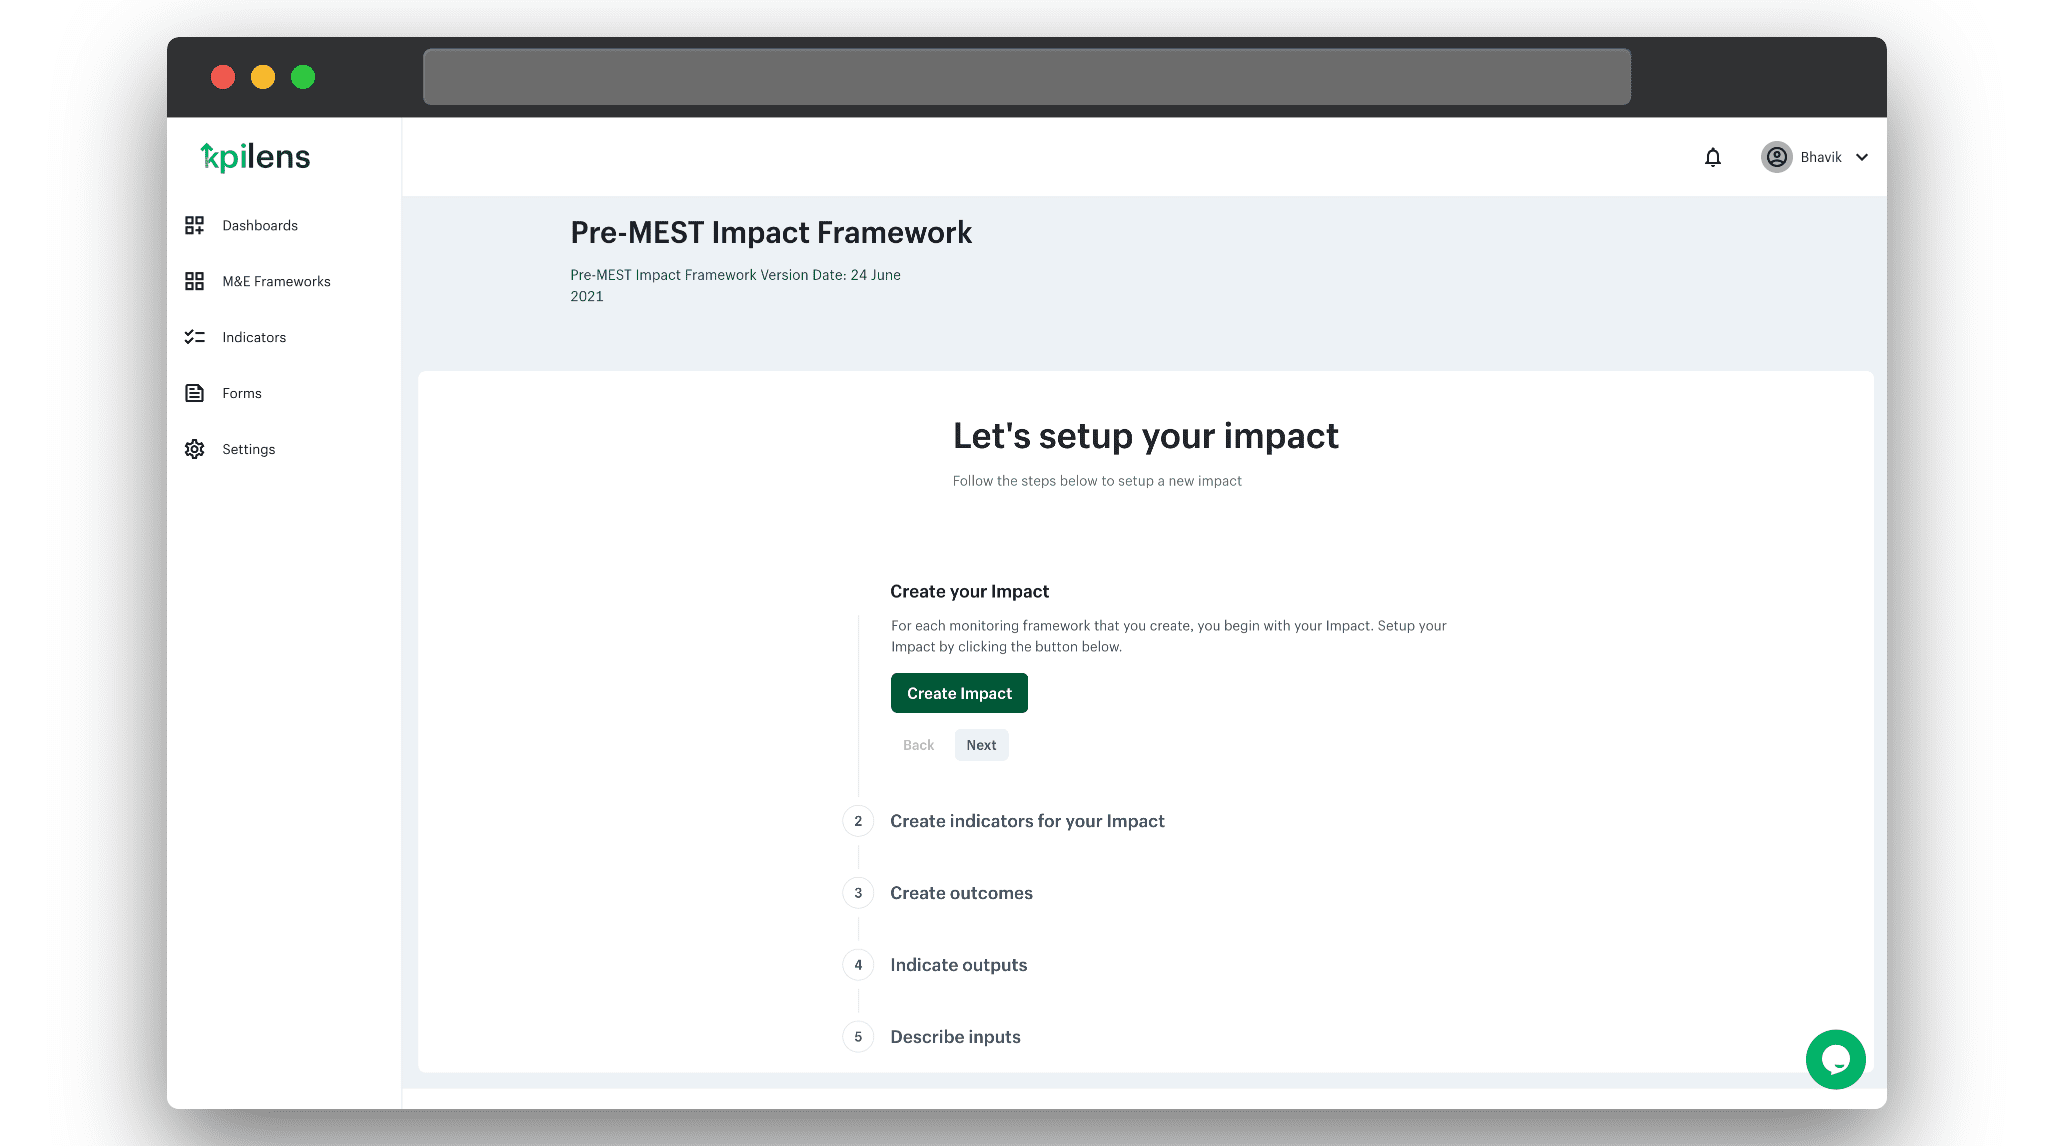
Preview of an intial, empty framework.
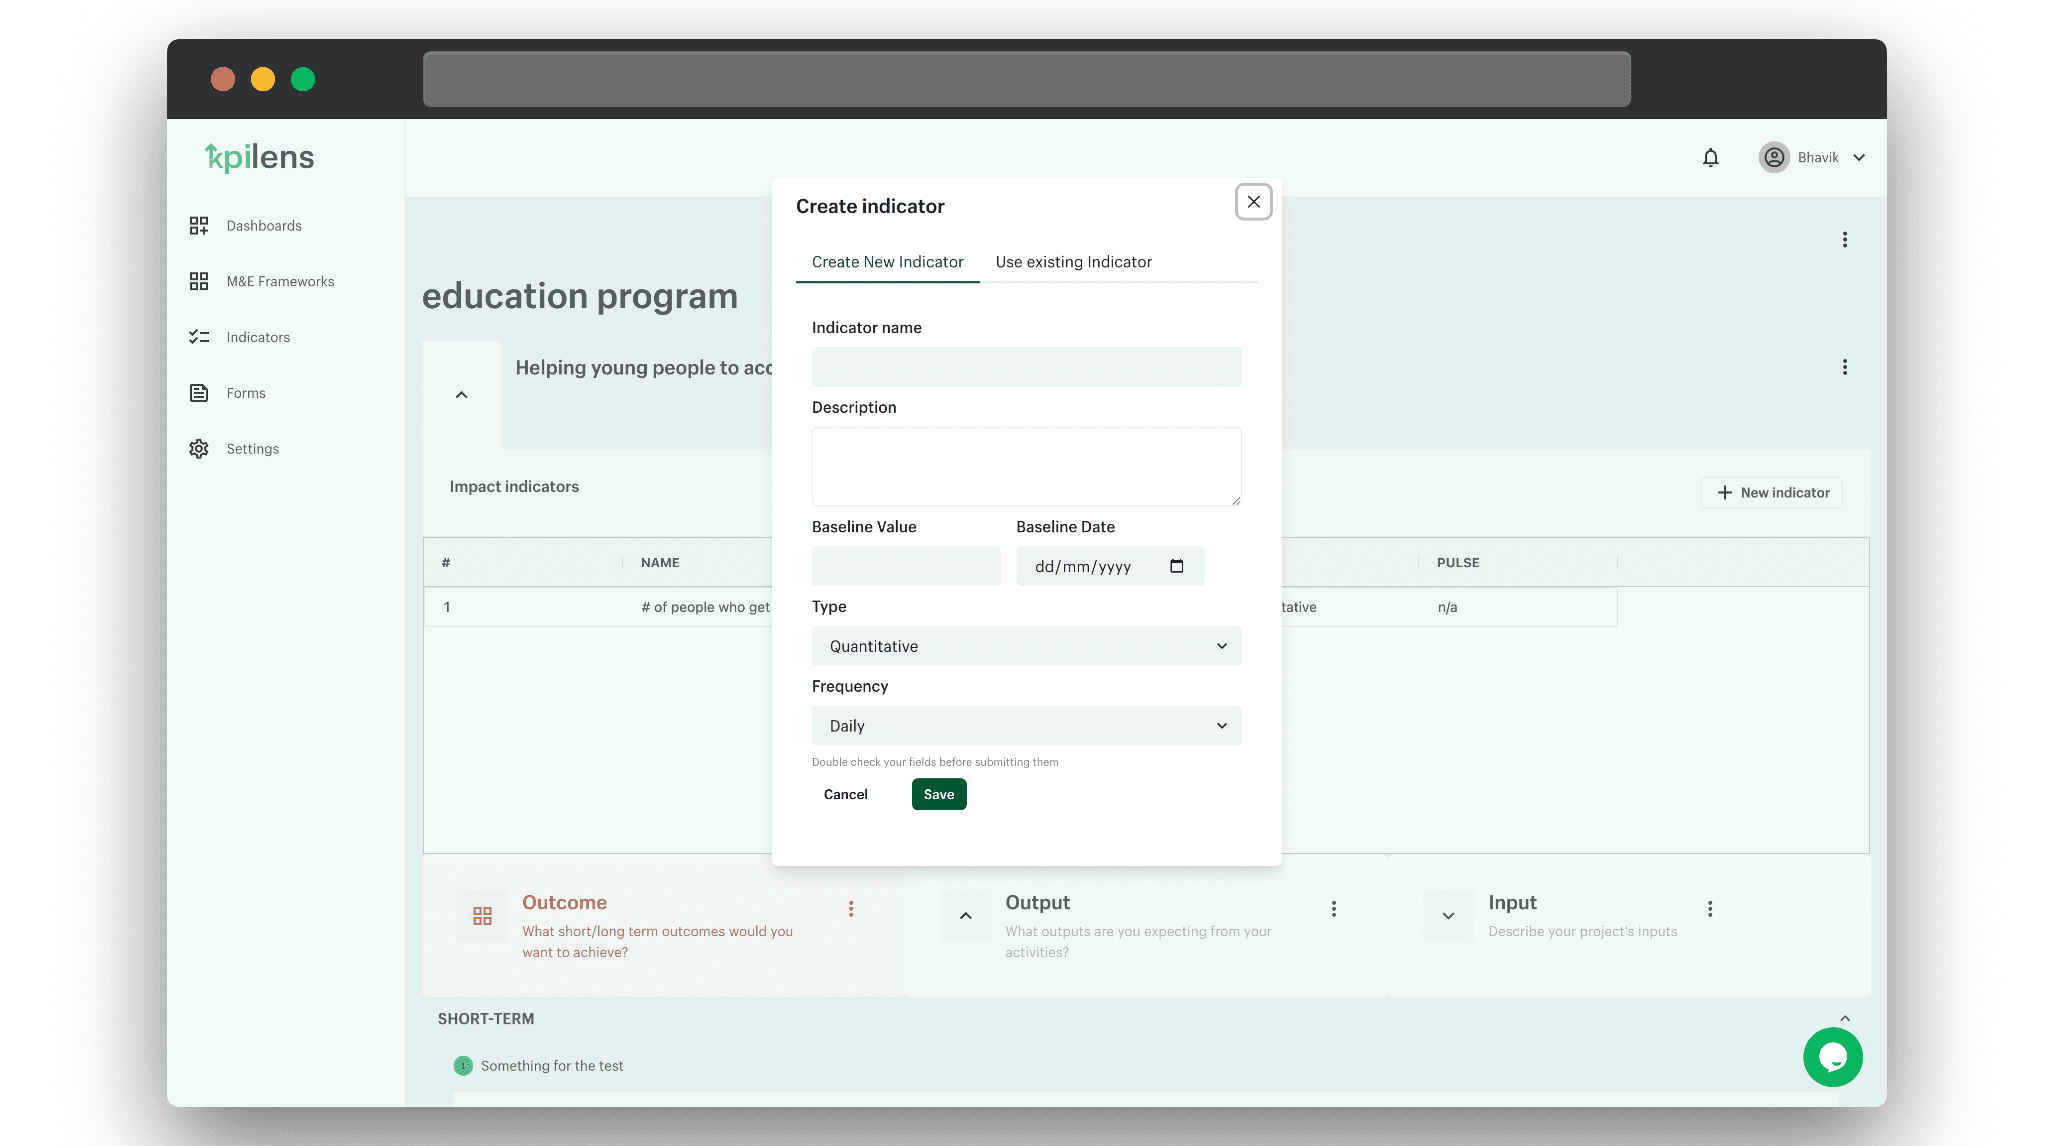
Create indicators for the framework.
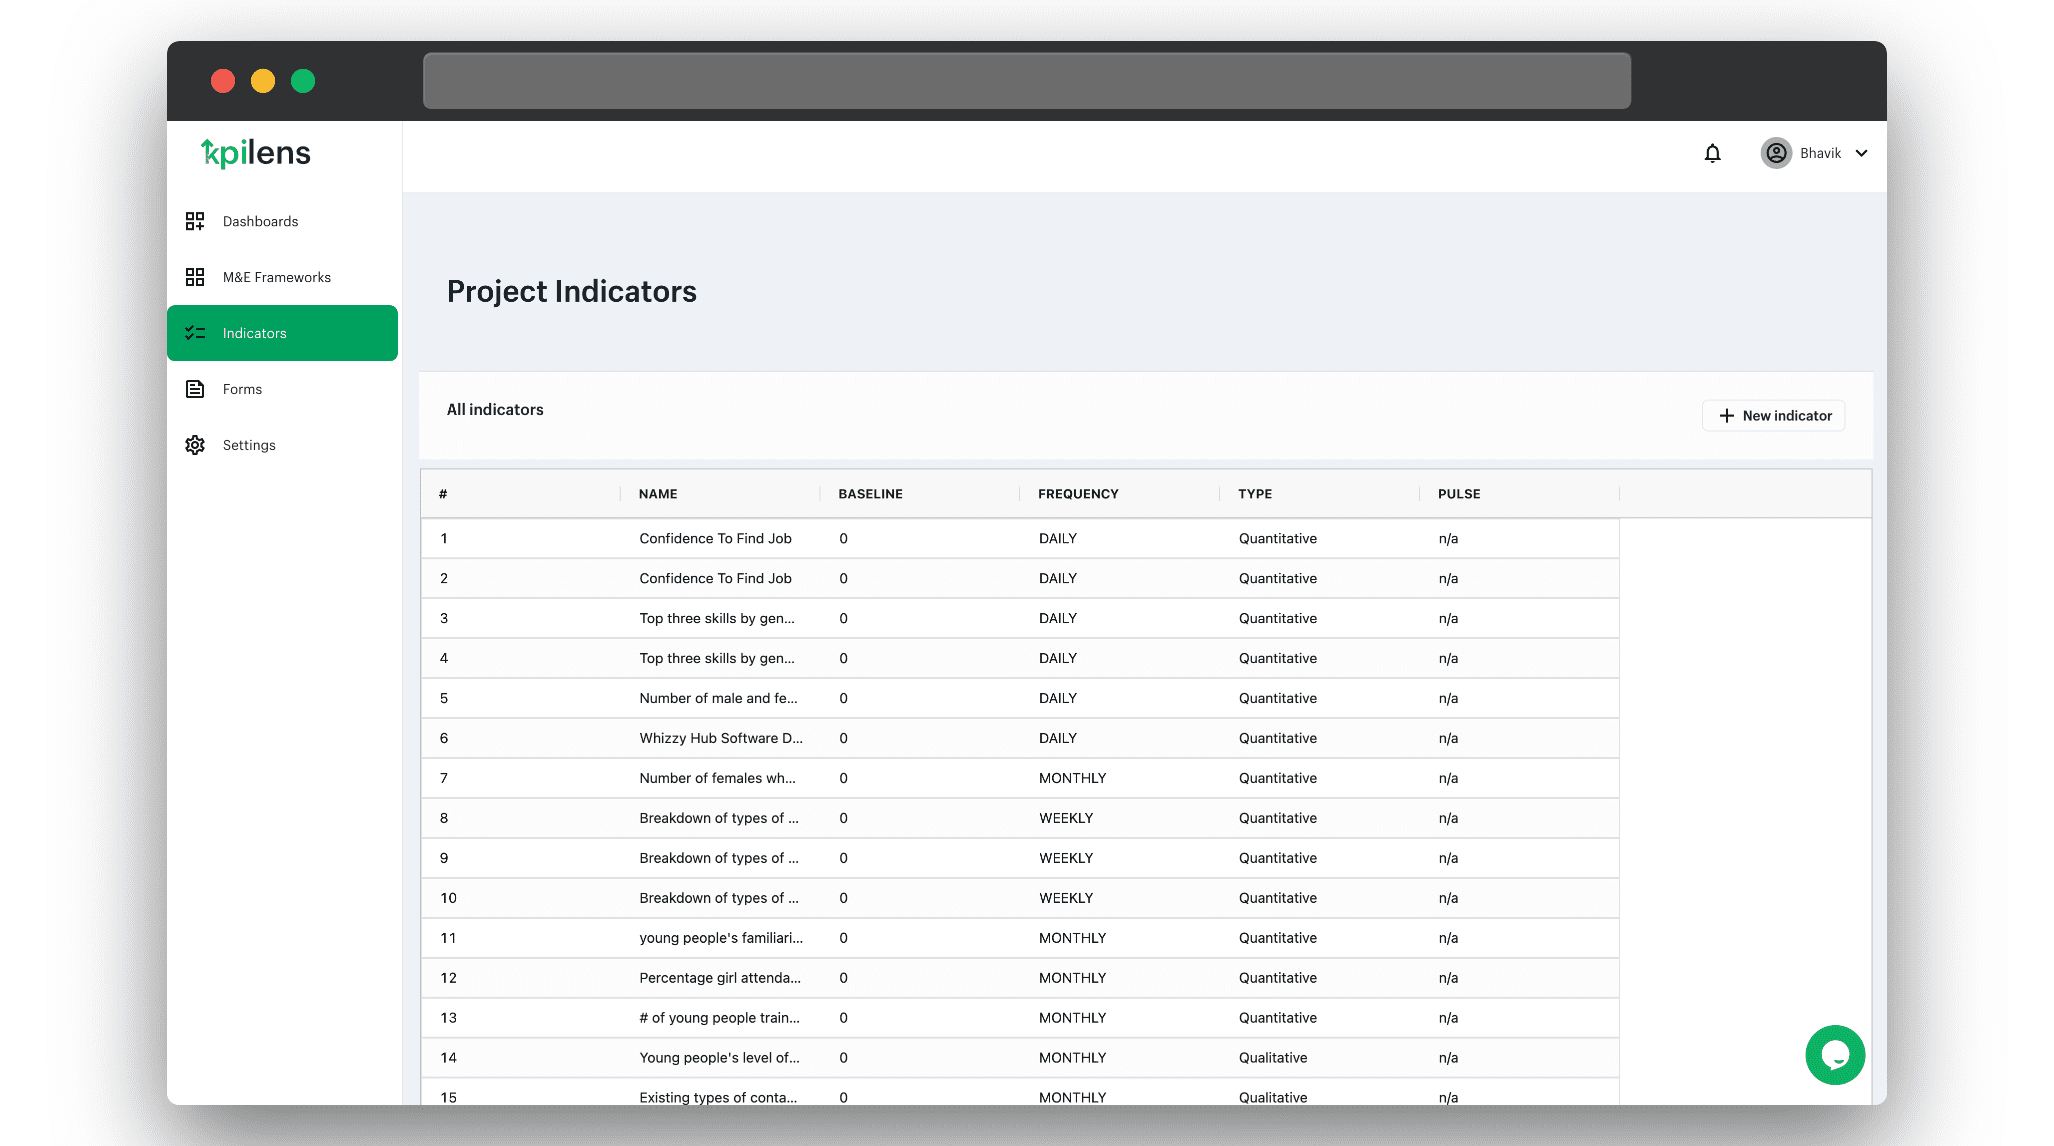
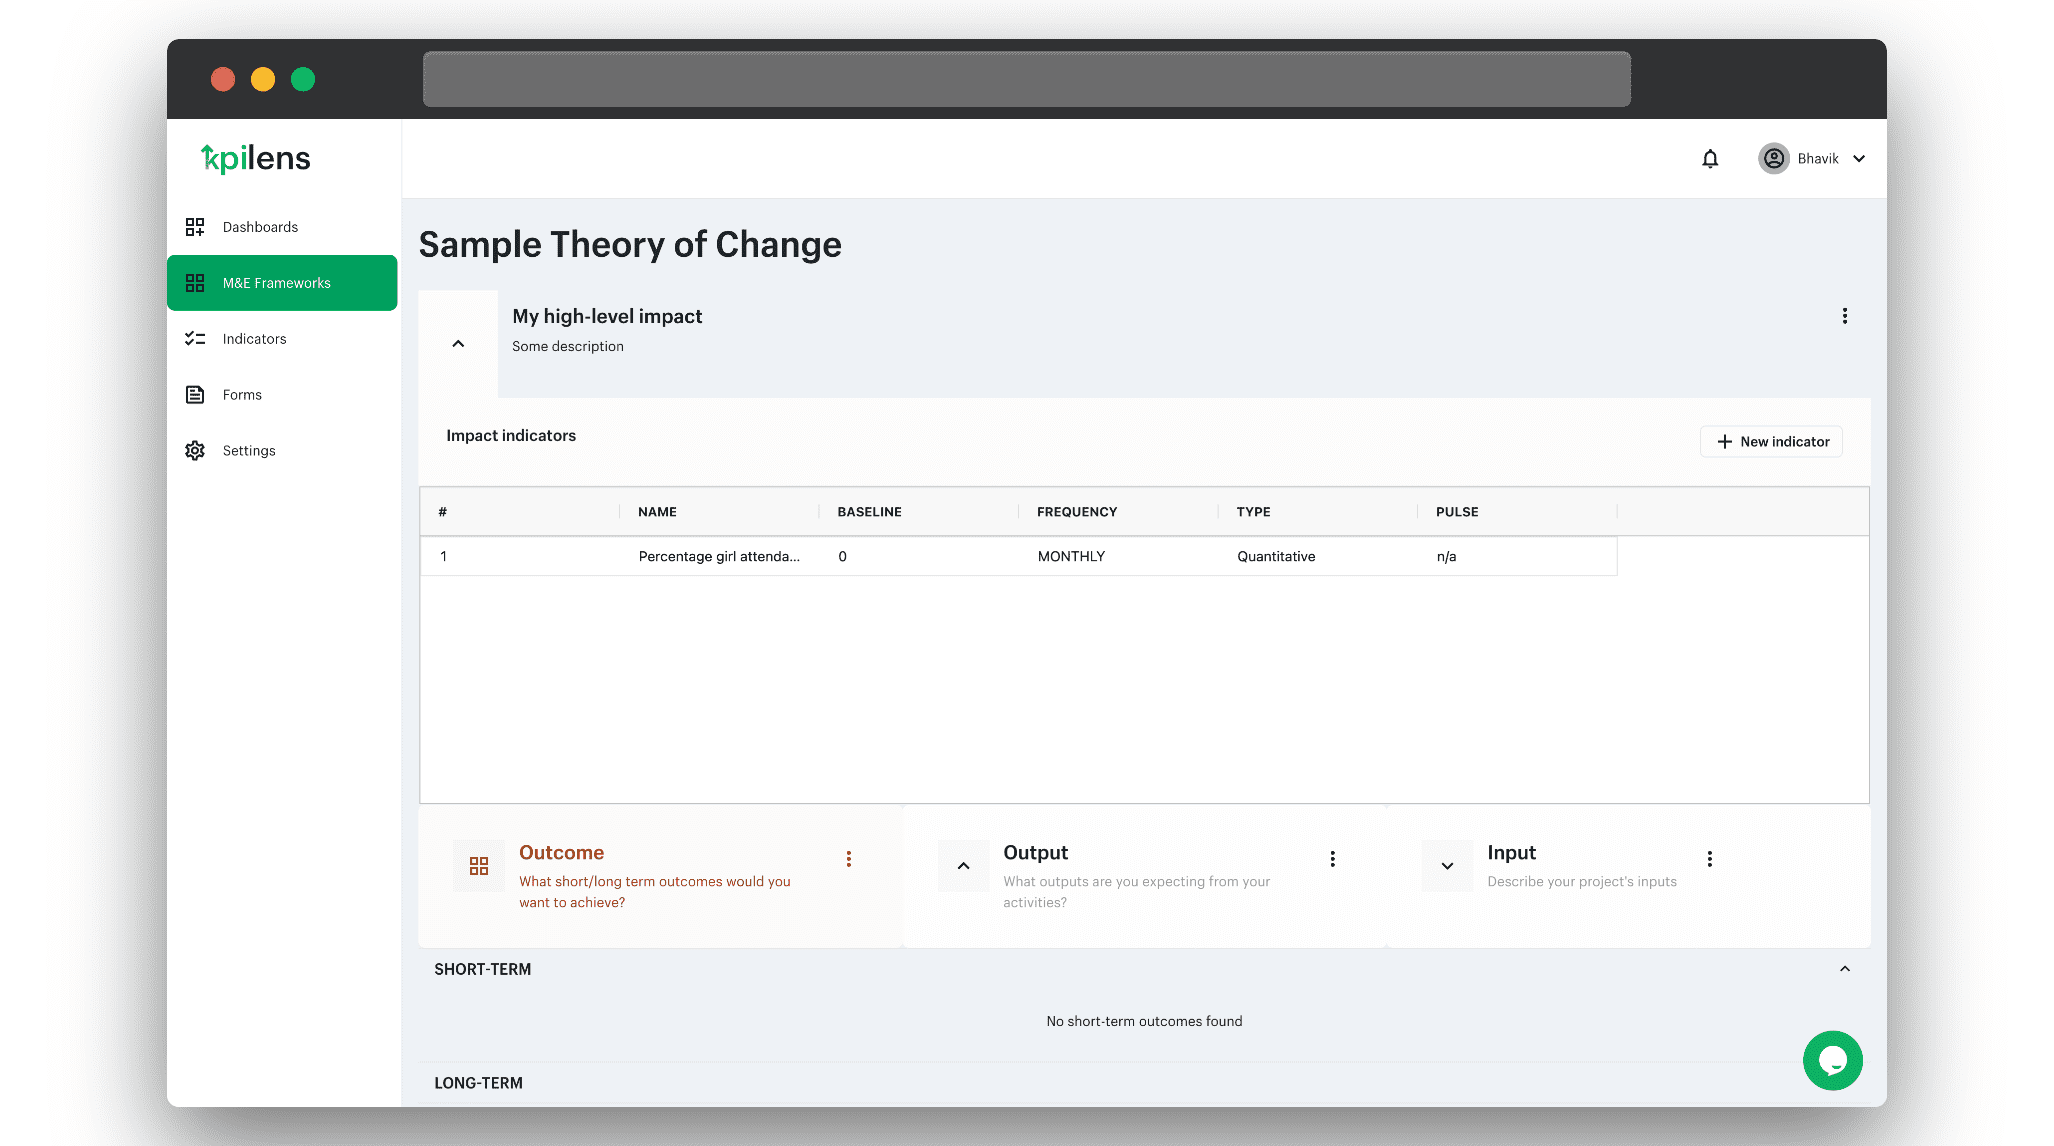
Manage the project indicators table.
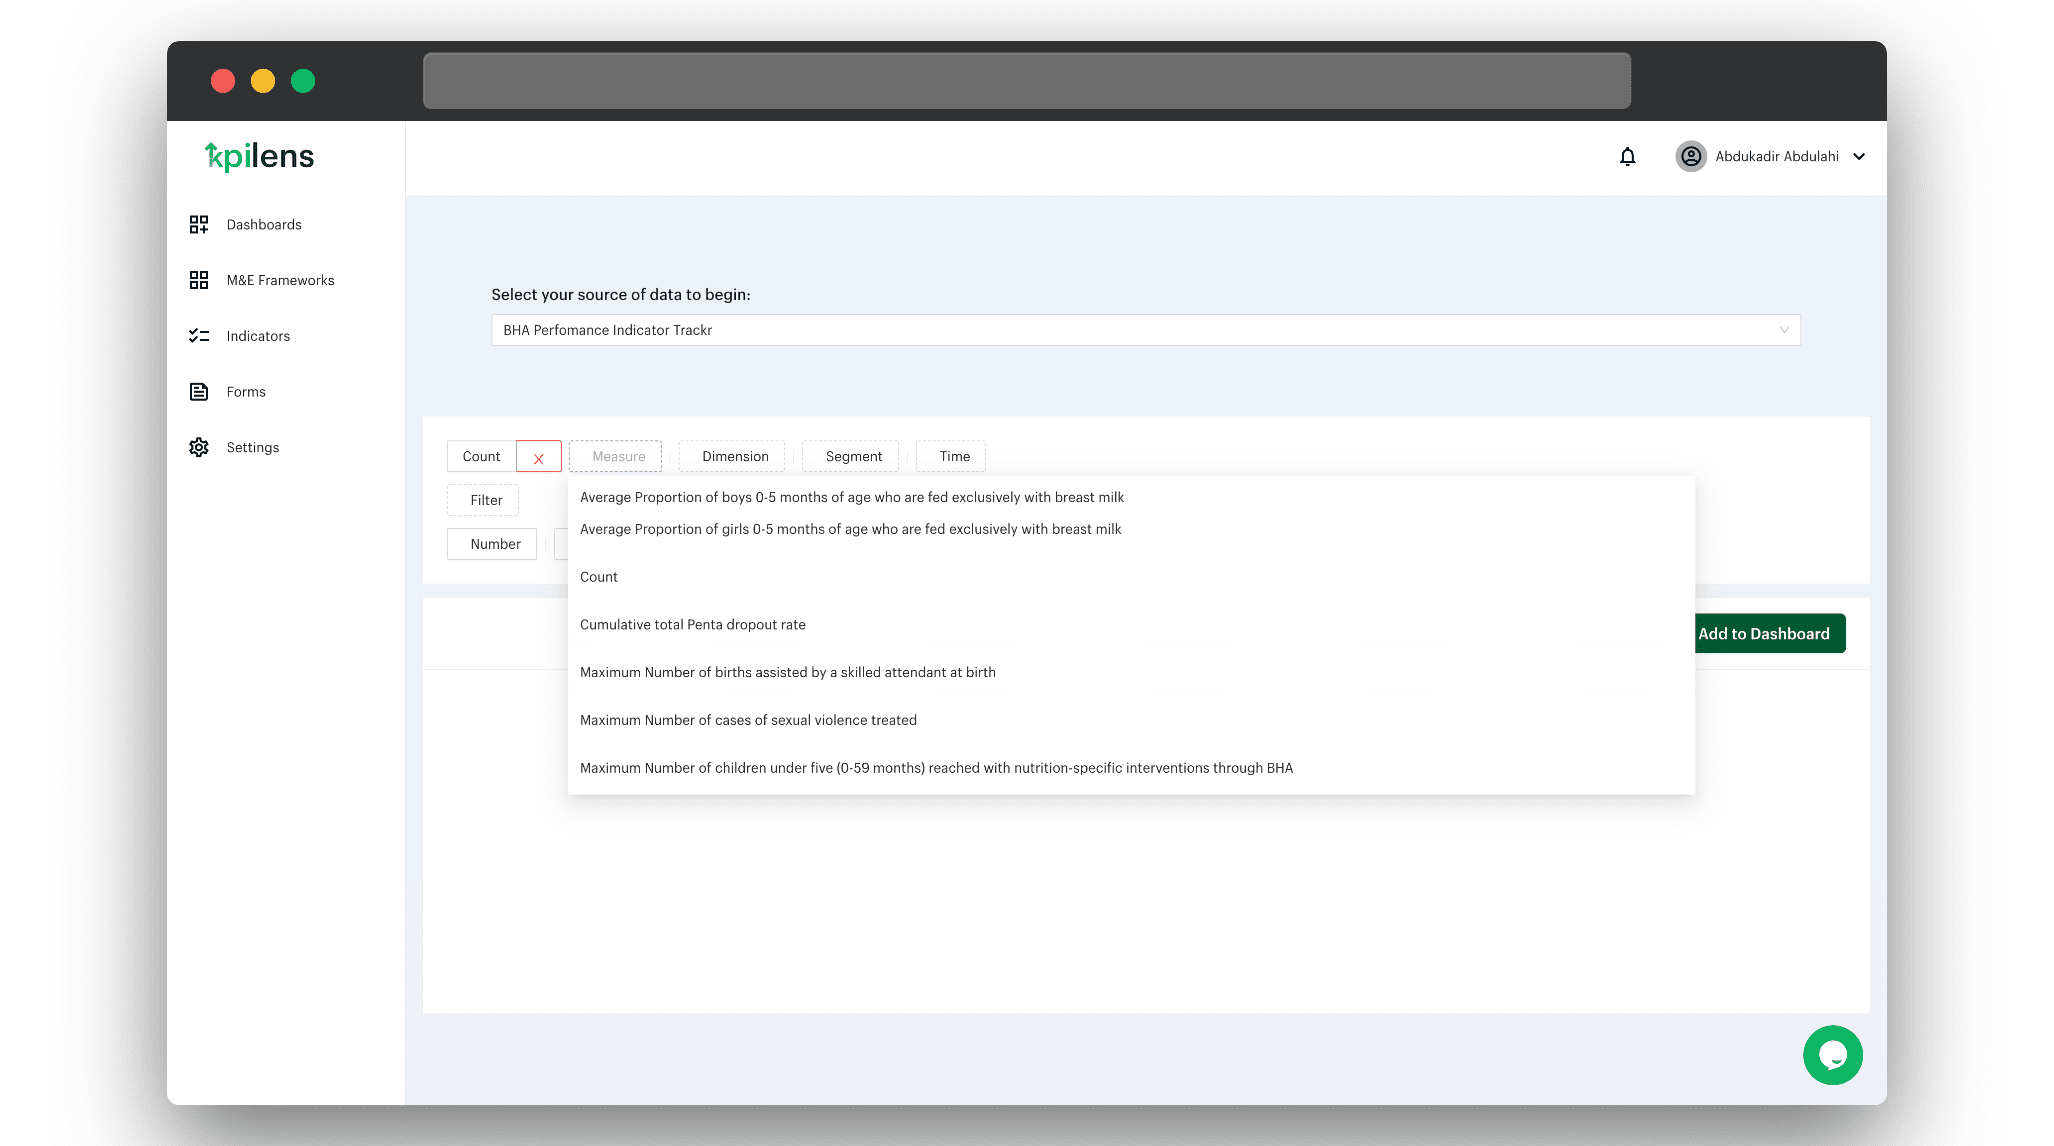
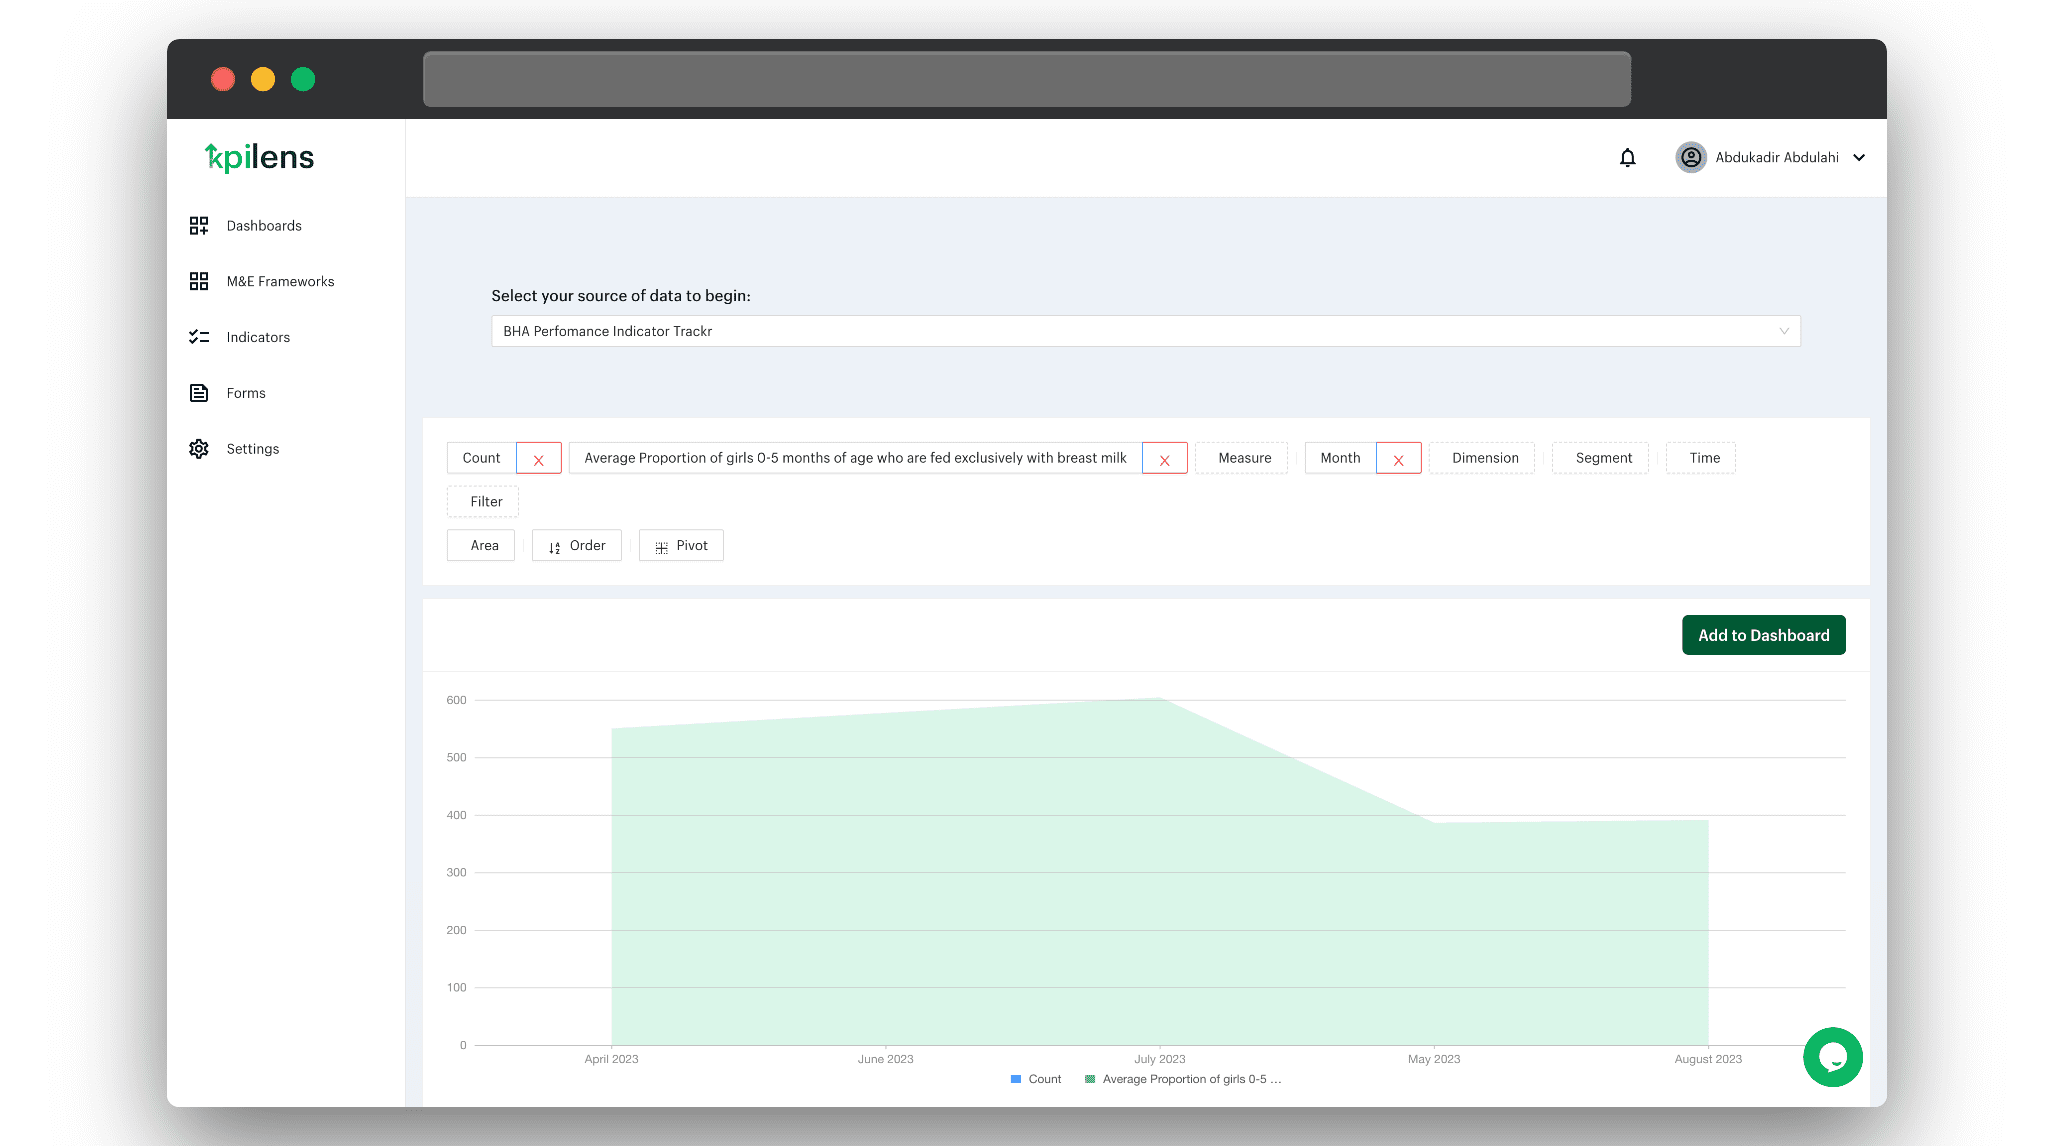
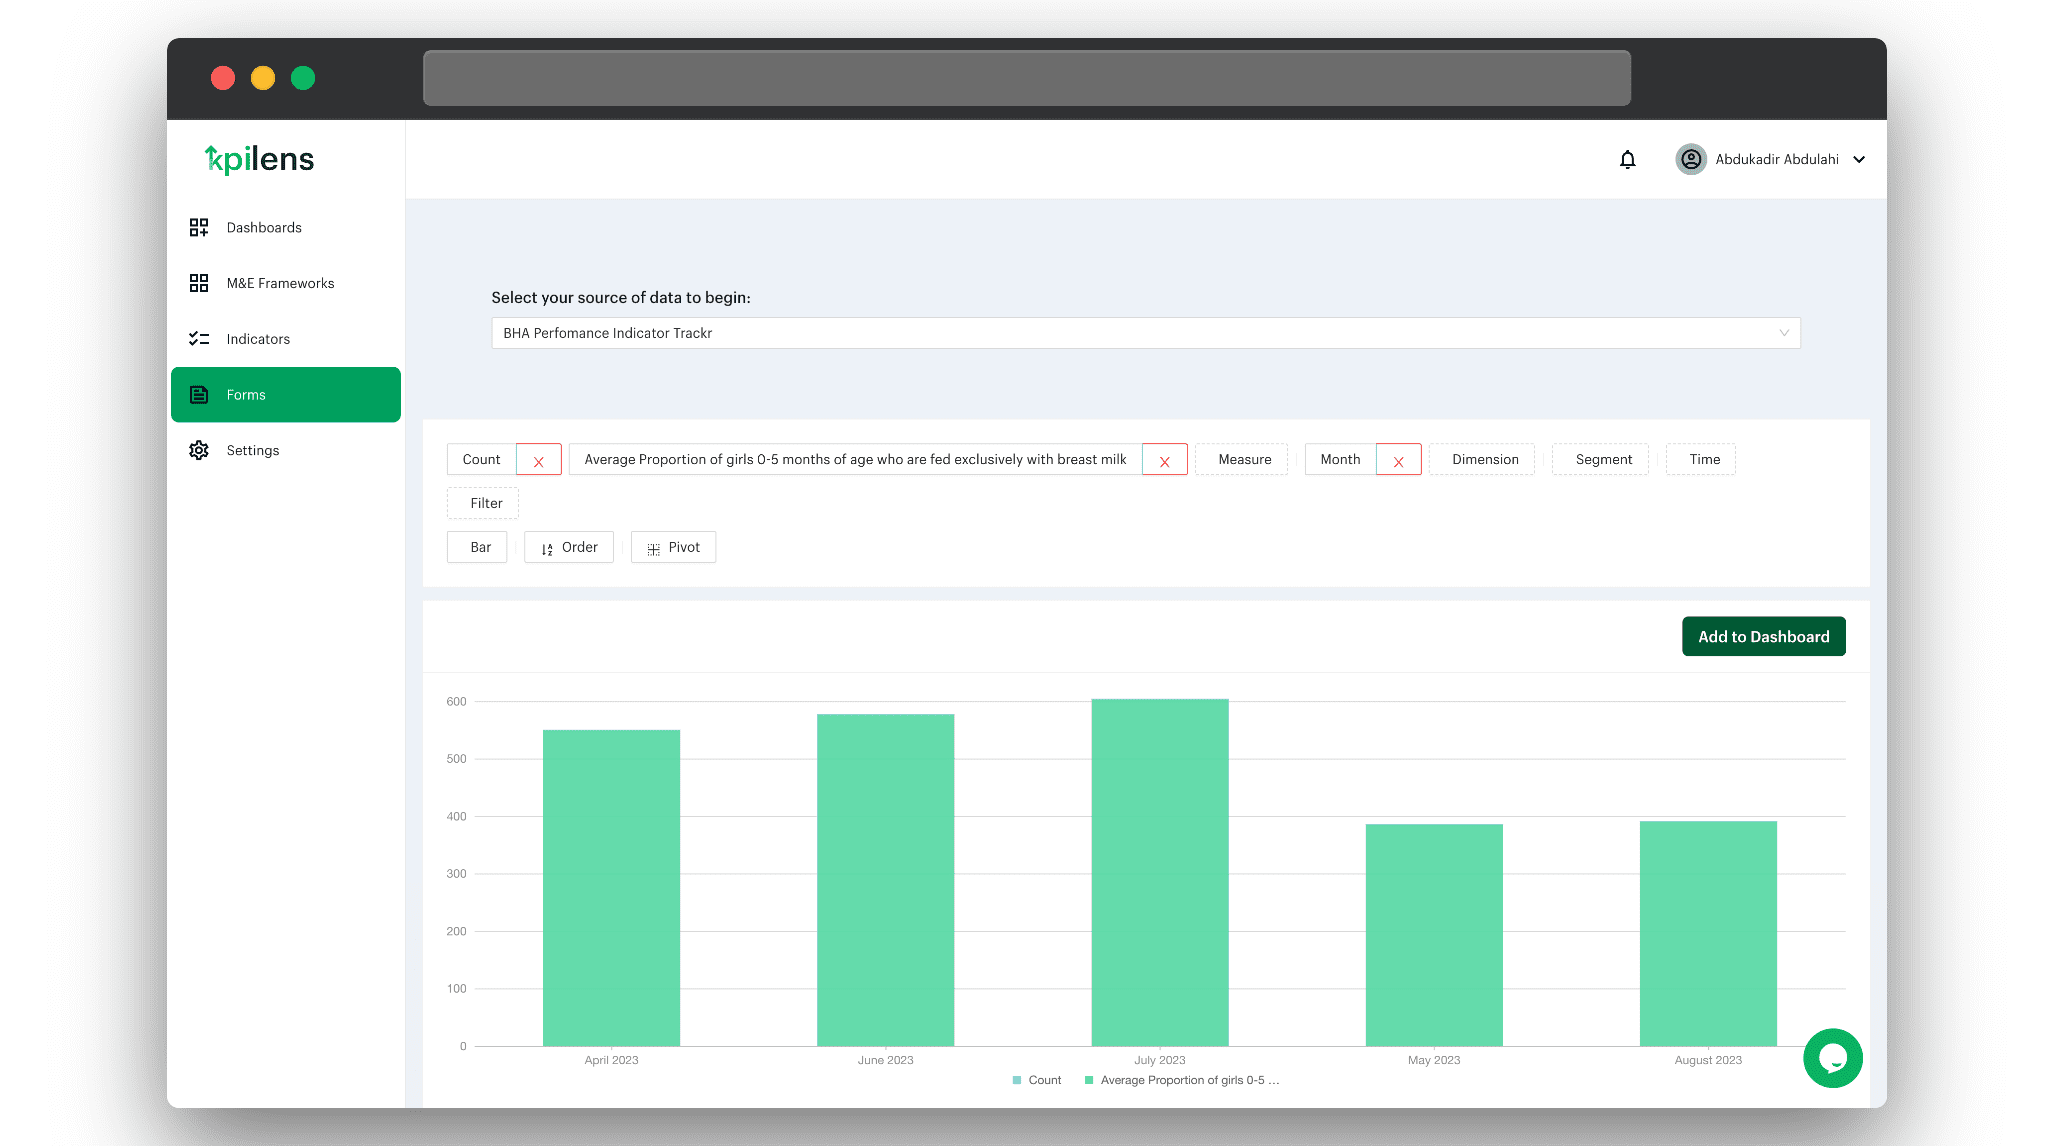
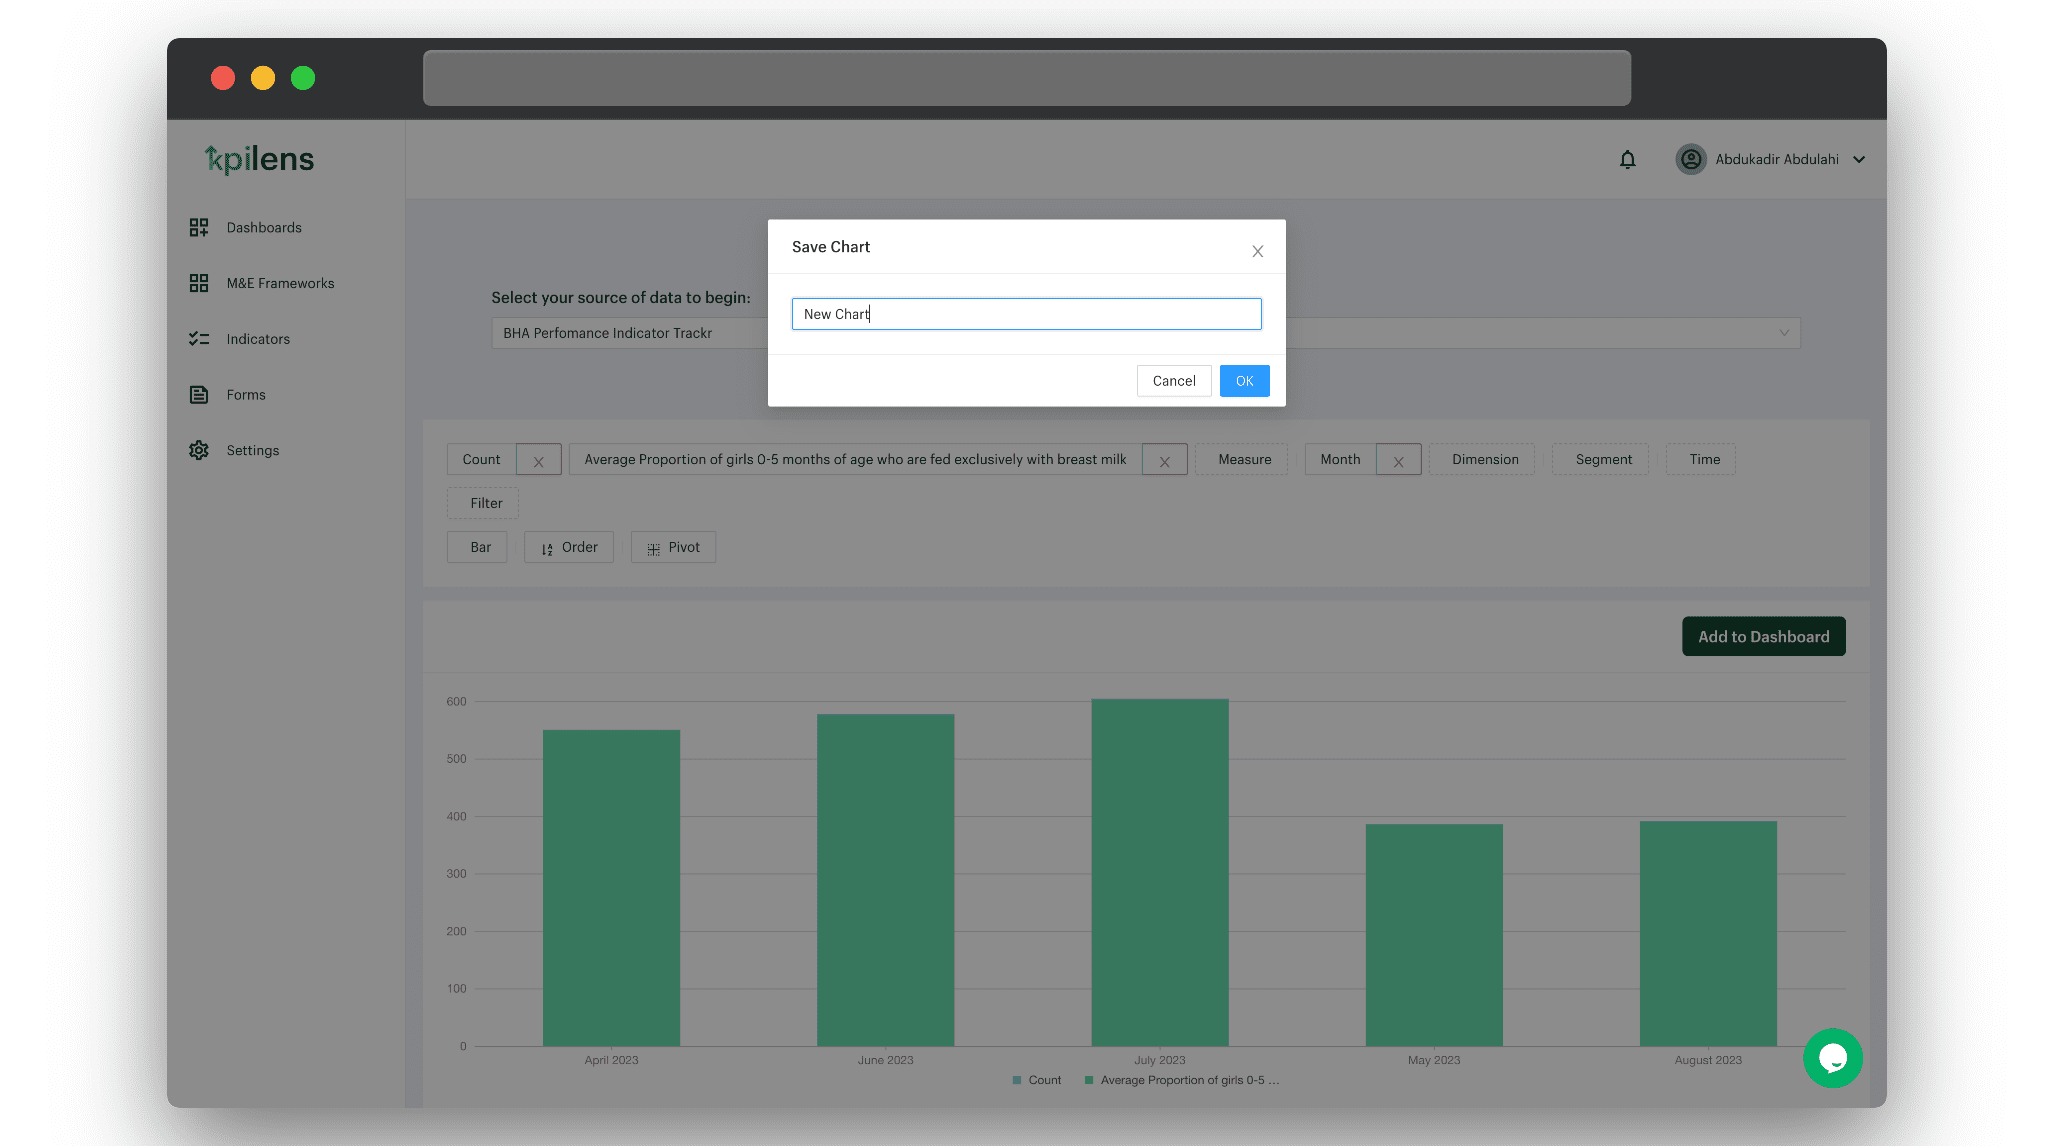
Indicator Query Builder
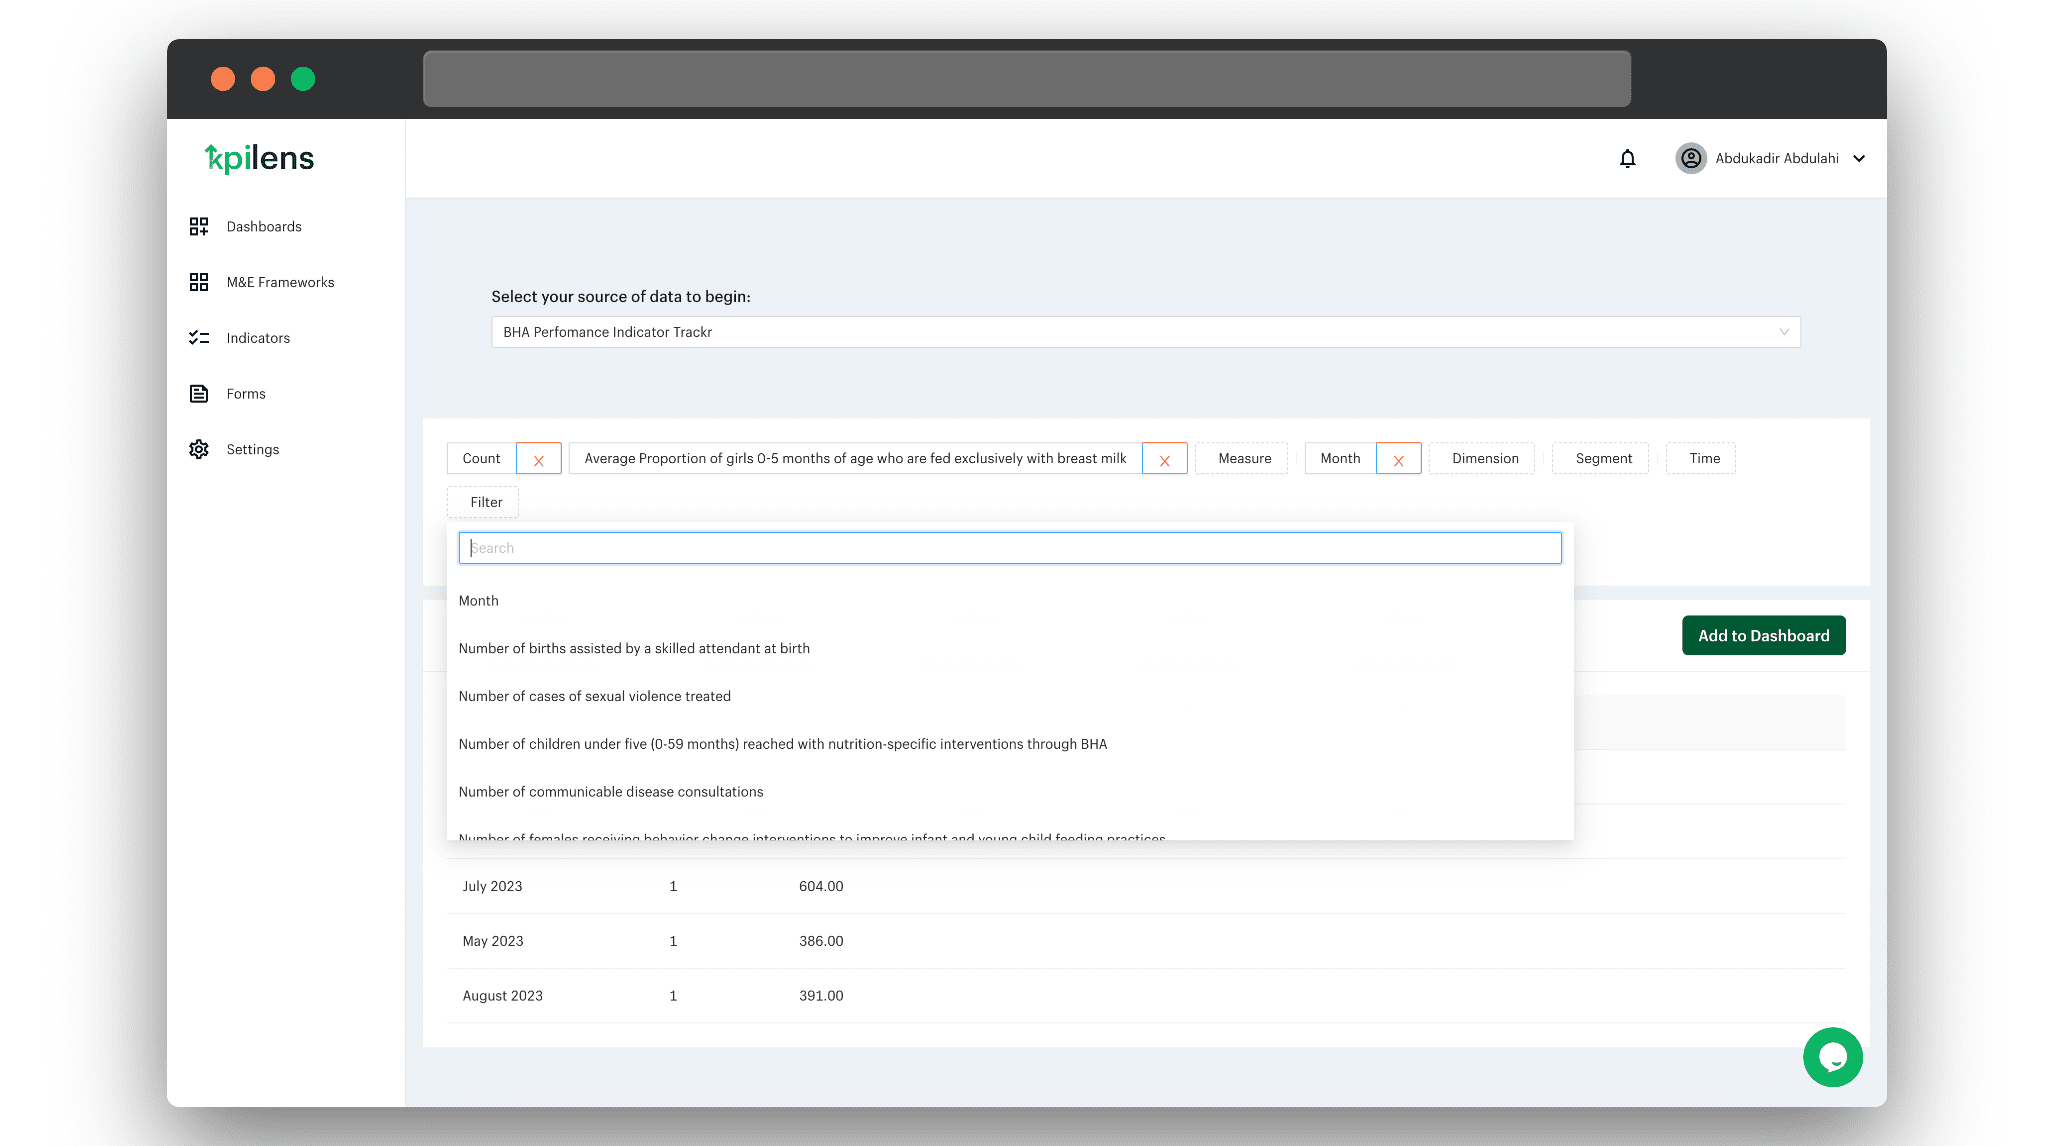
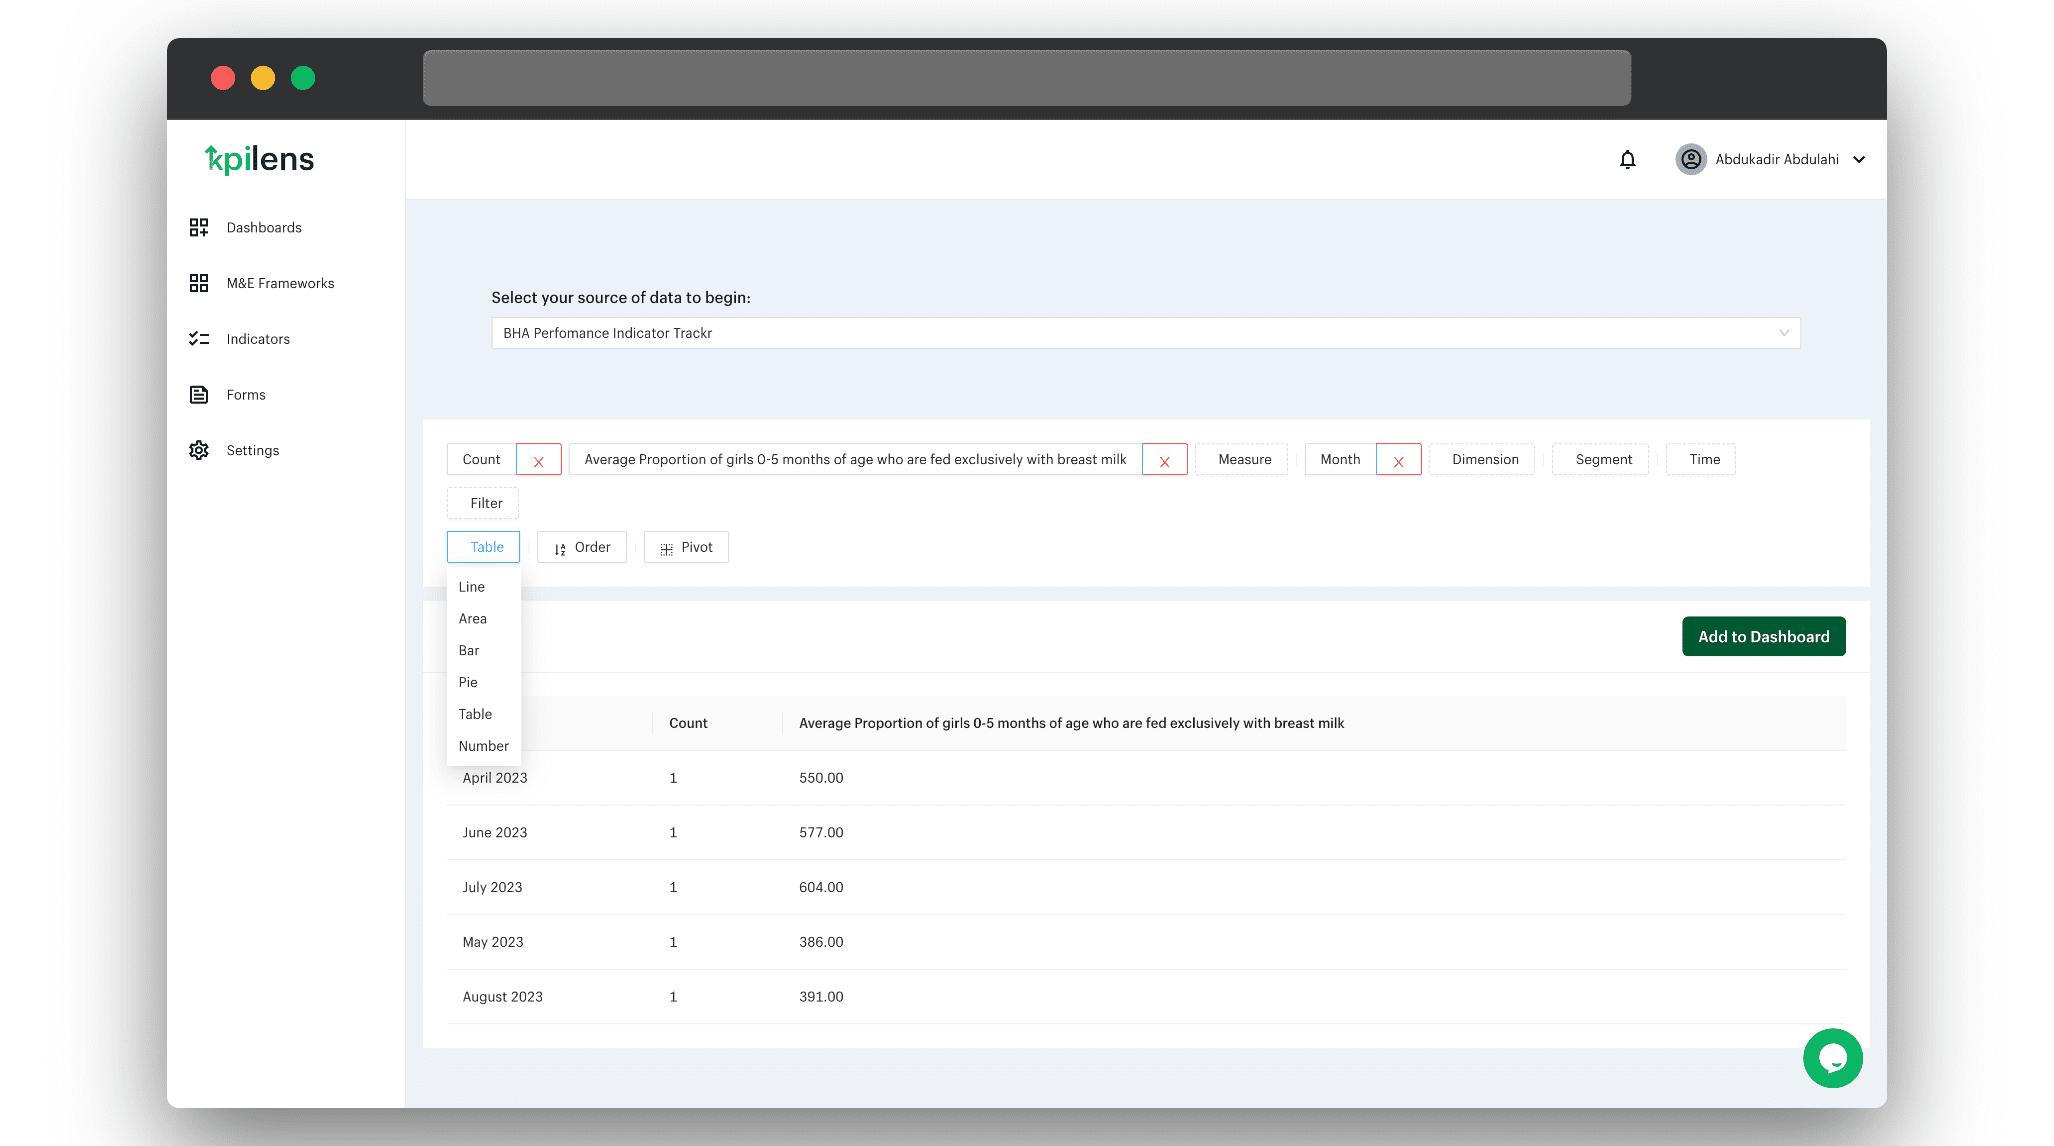
Questions about the data collected are answered with an interface called the indicator query builder. Without writing any SQL, options about the data are provided in dropdowns which are selected by the user to query information that meets the requirements of the indicator. Charts and tables are then generated from the results and saved as dashboards which can be shared with other stakeholders.
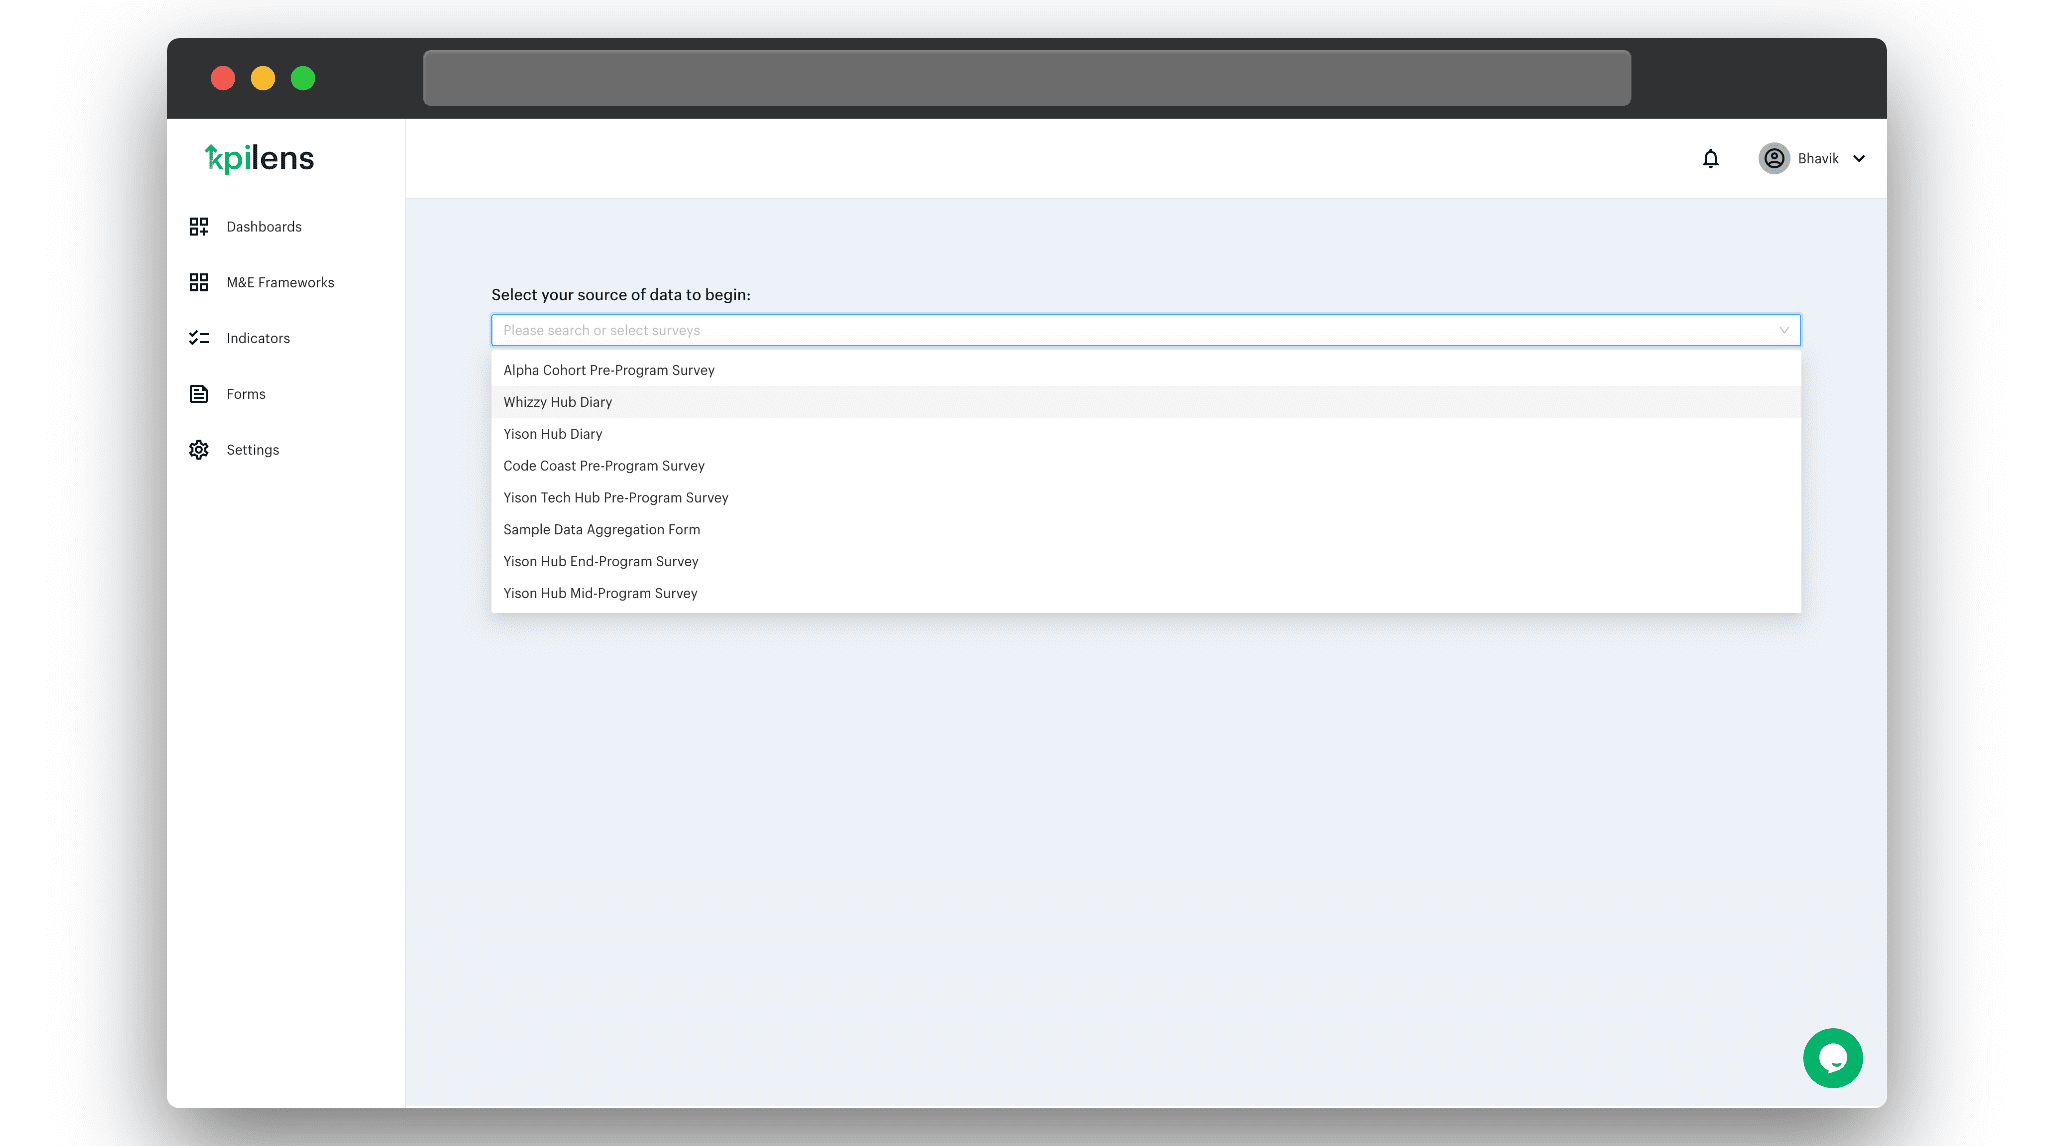
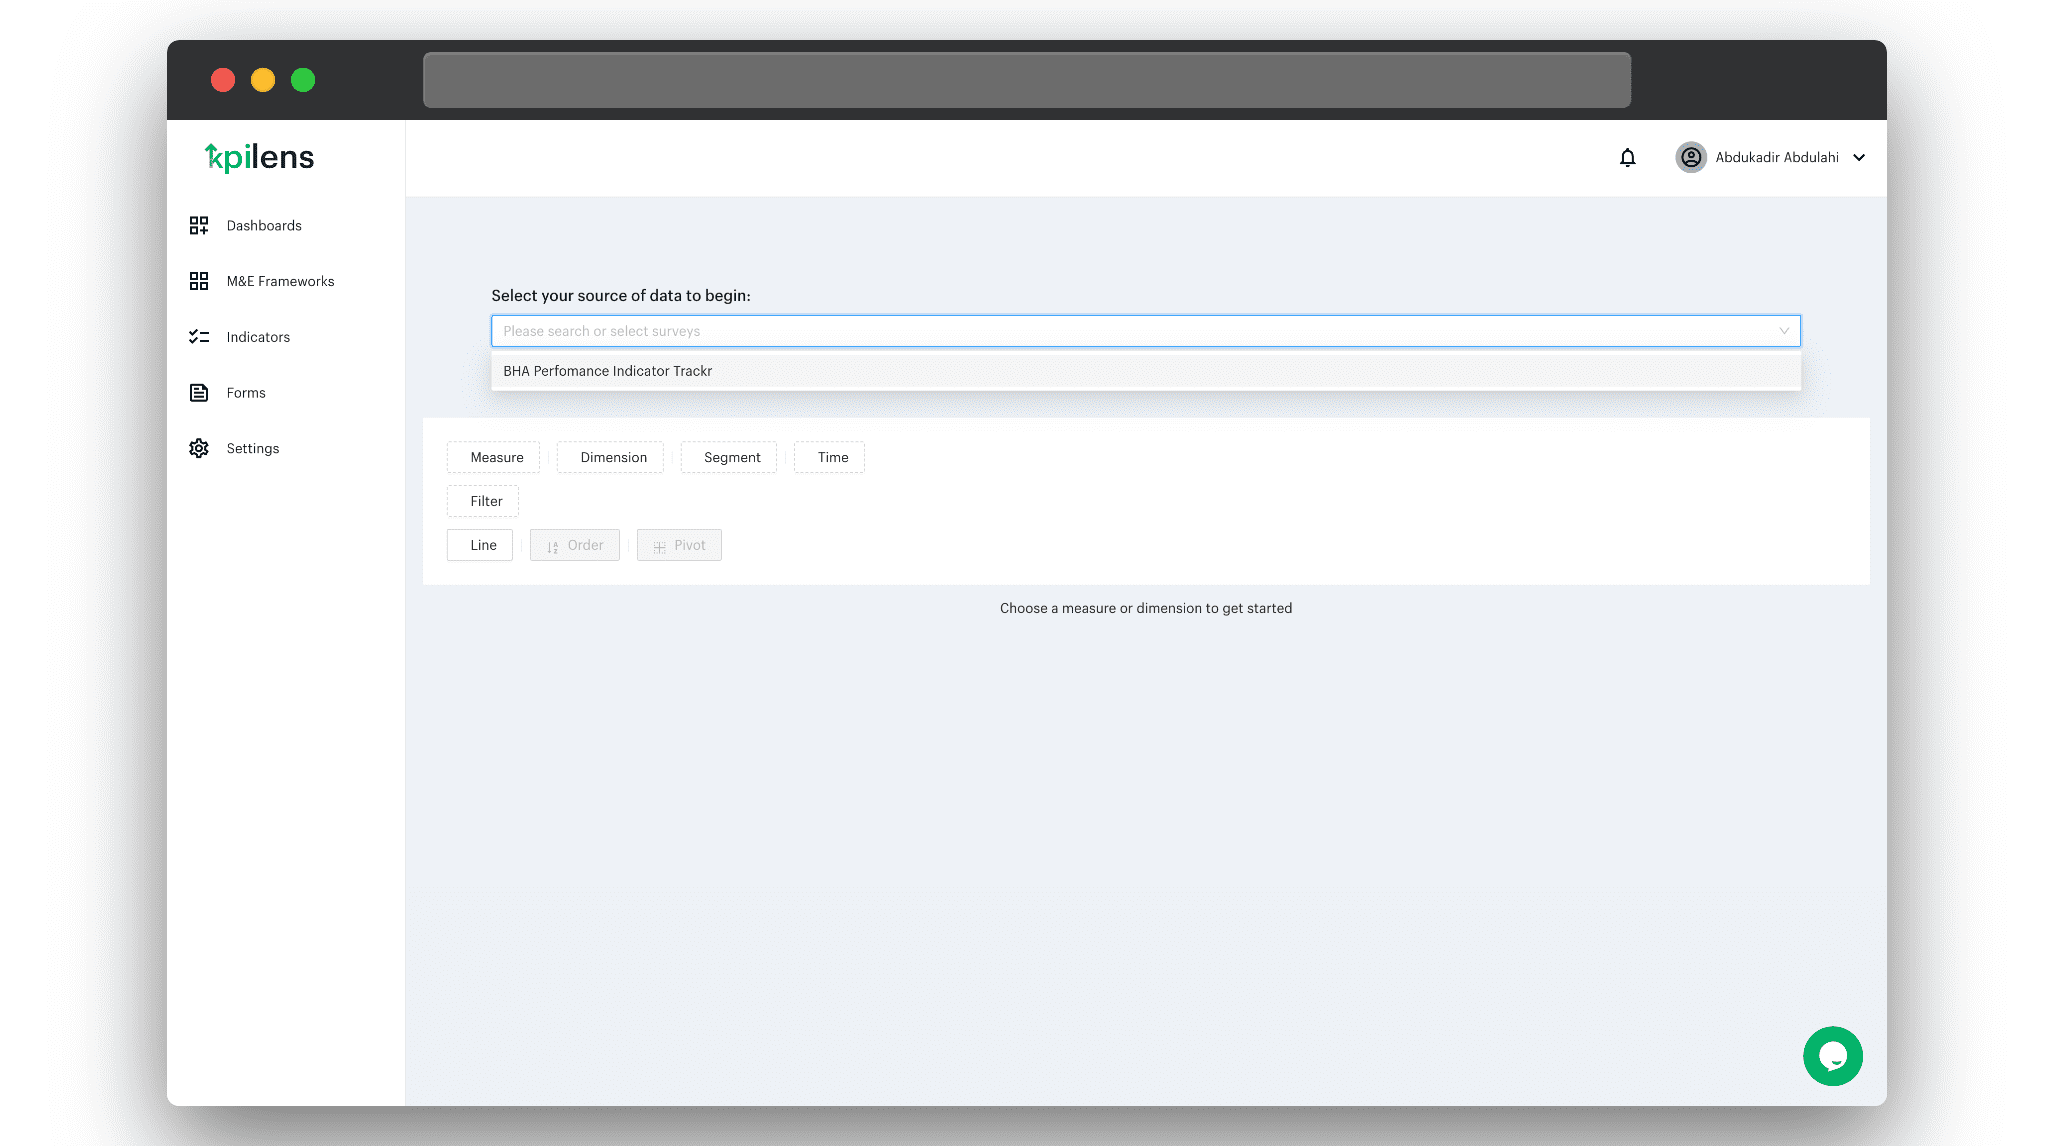
Select a source of data e.g a Survey.
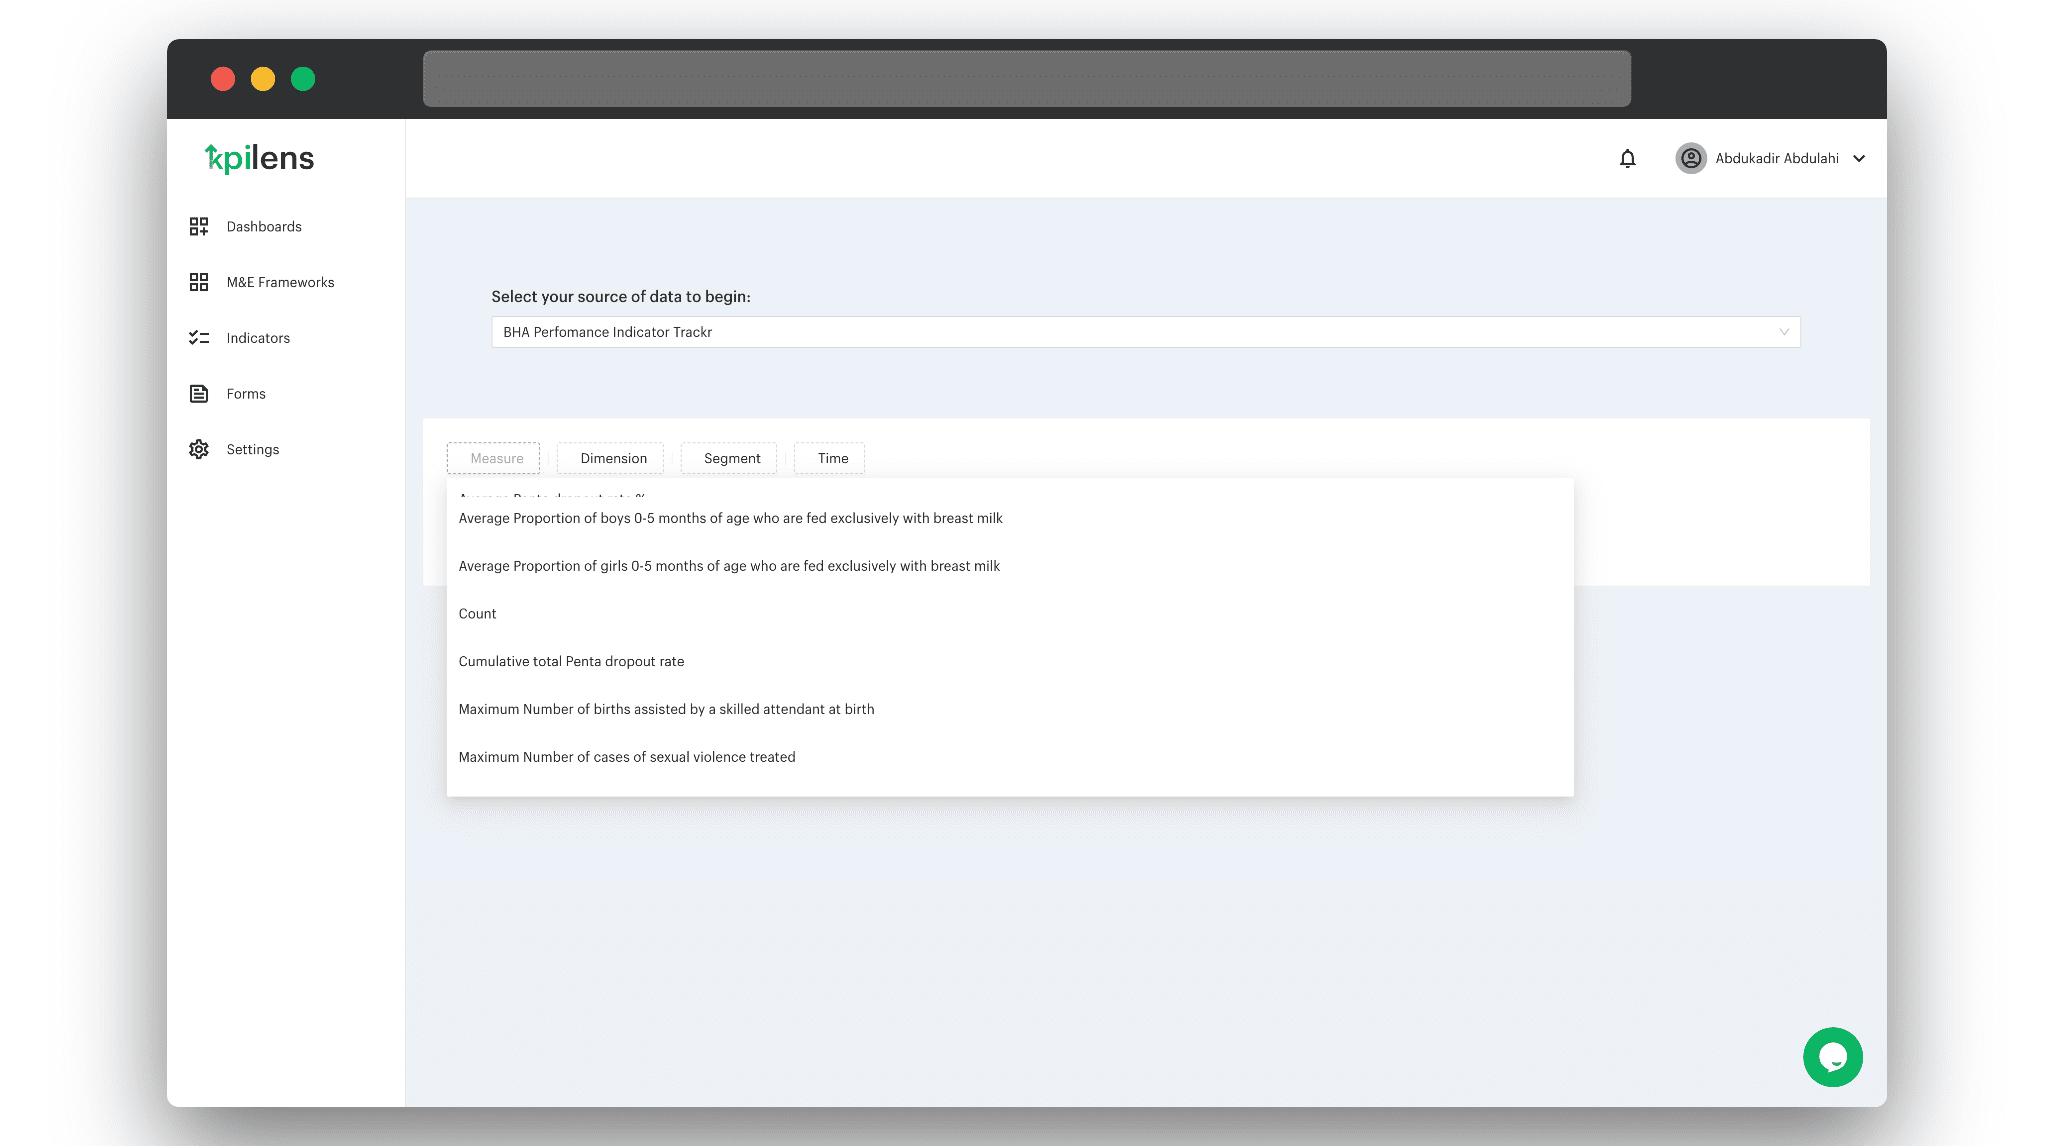
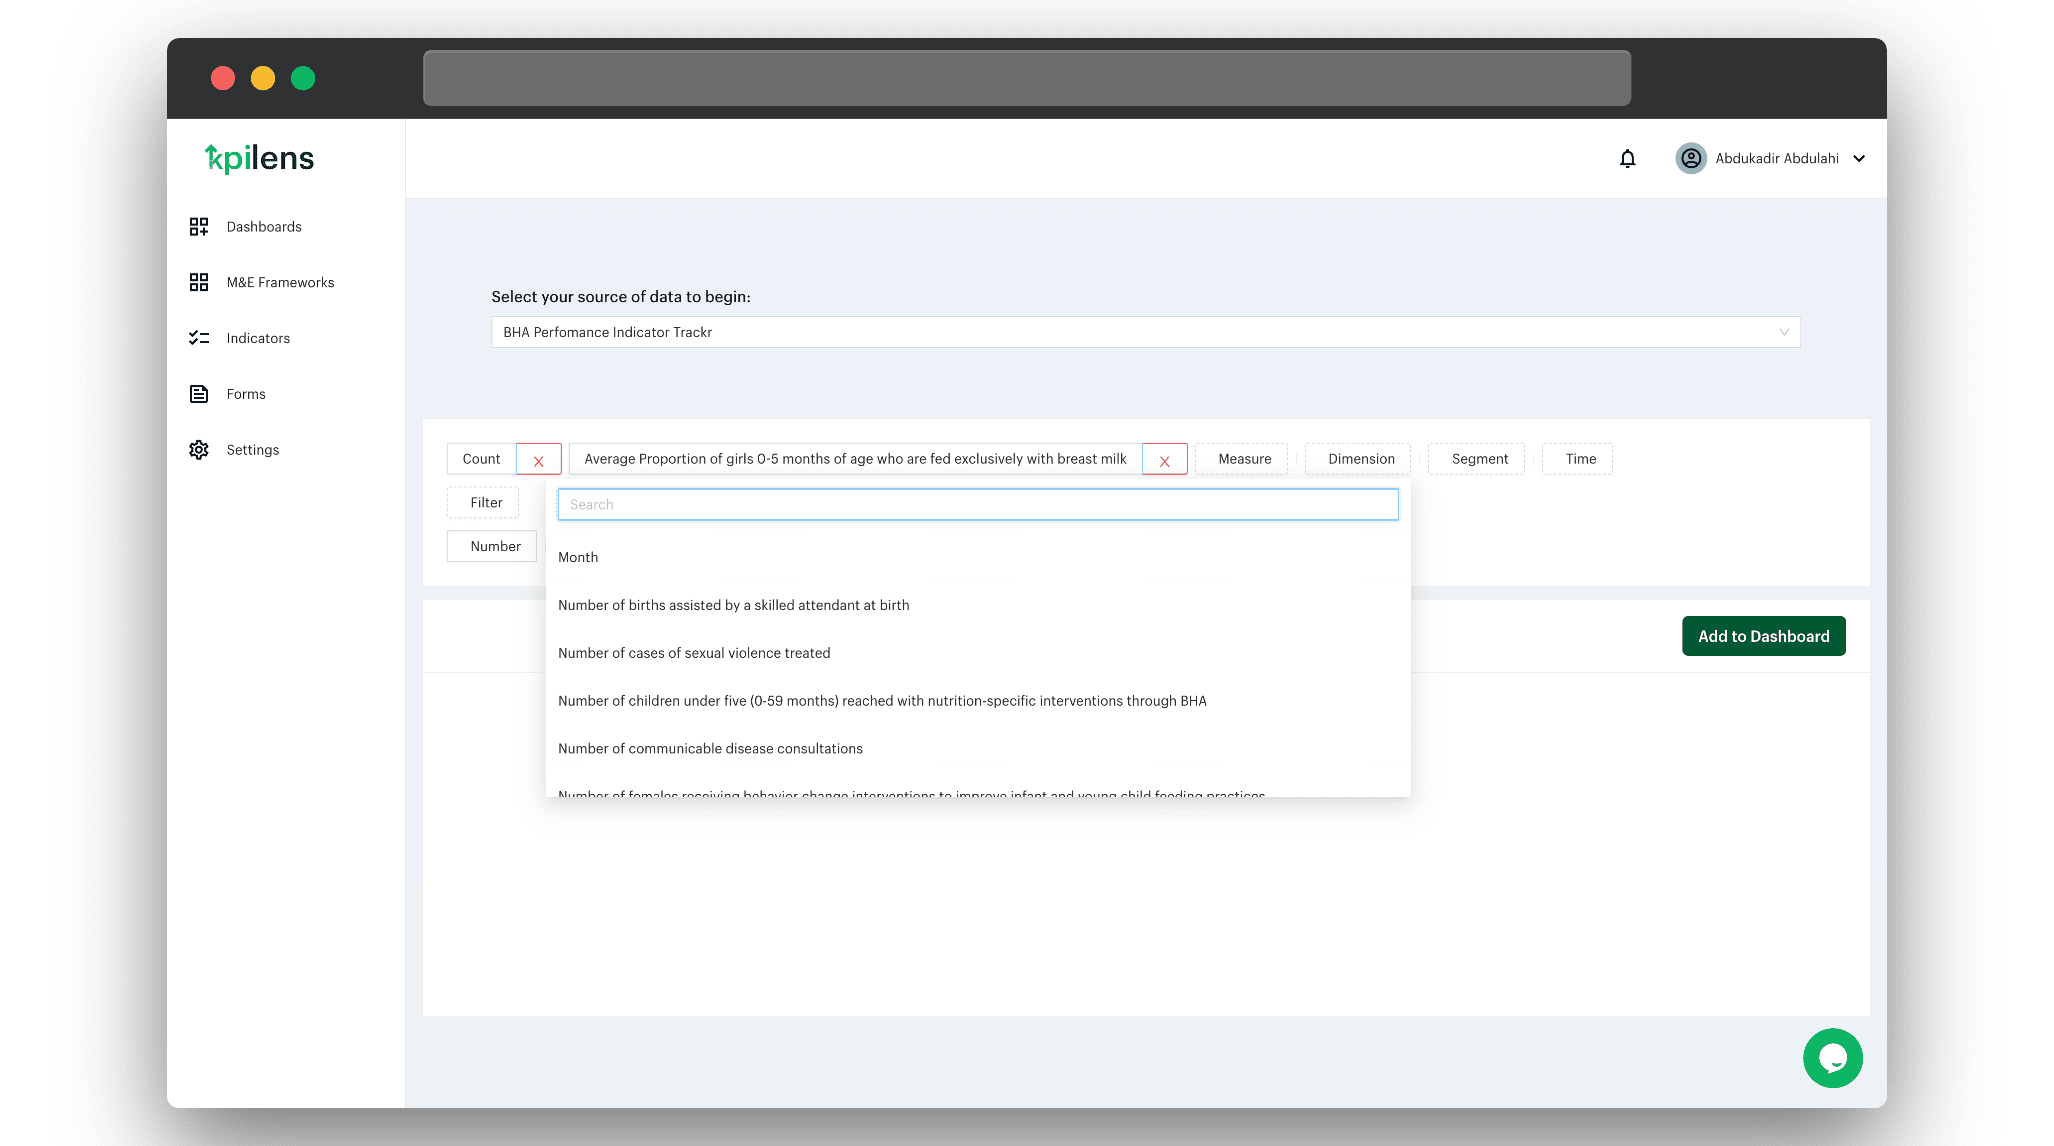
Optional selection of another measure.
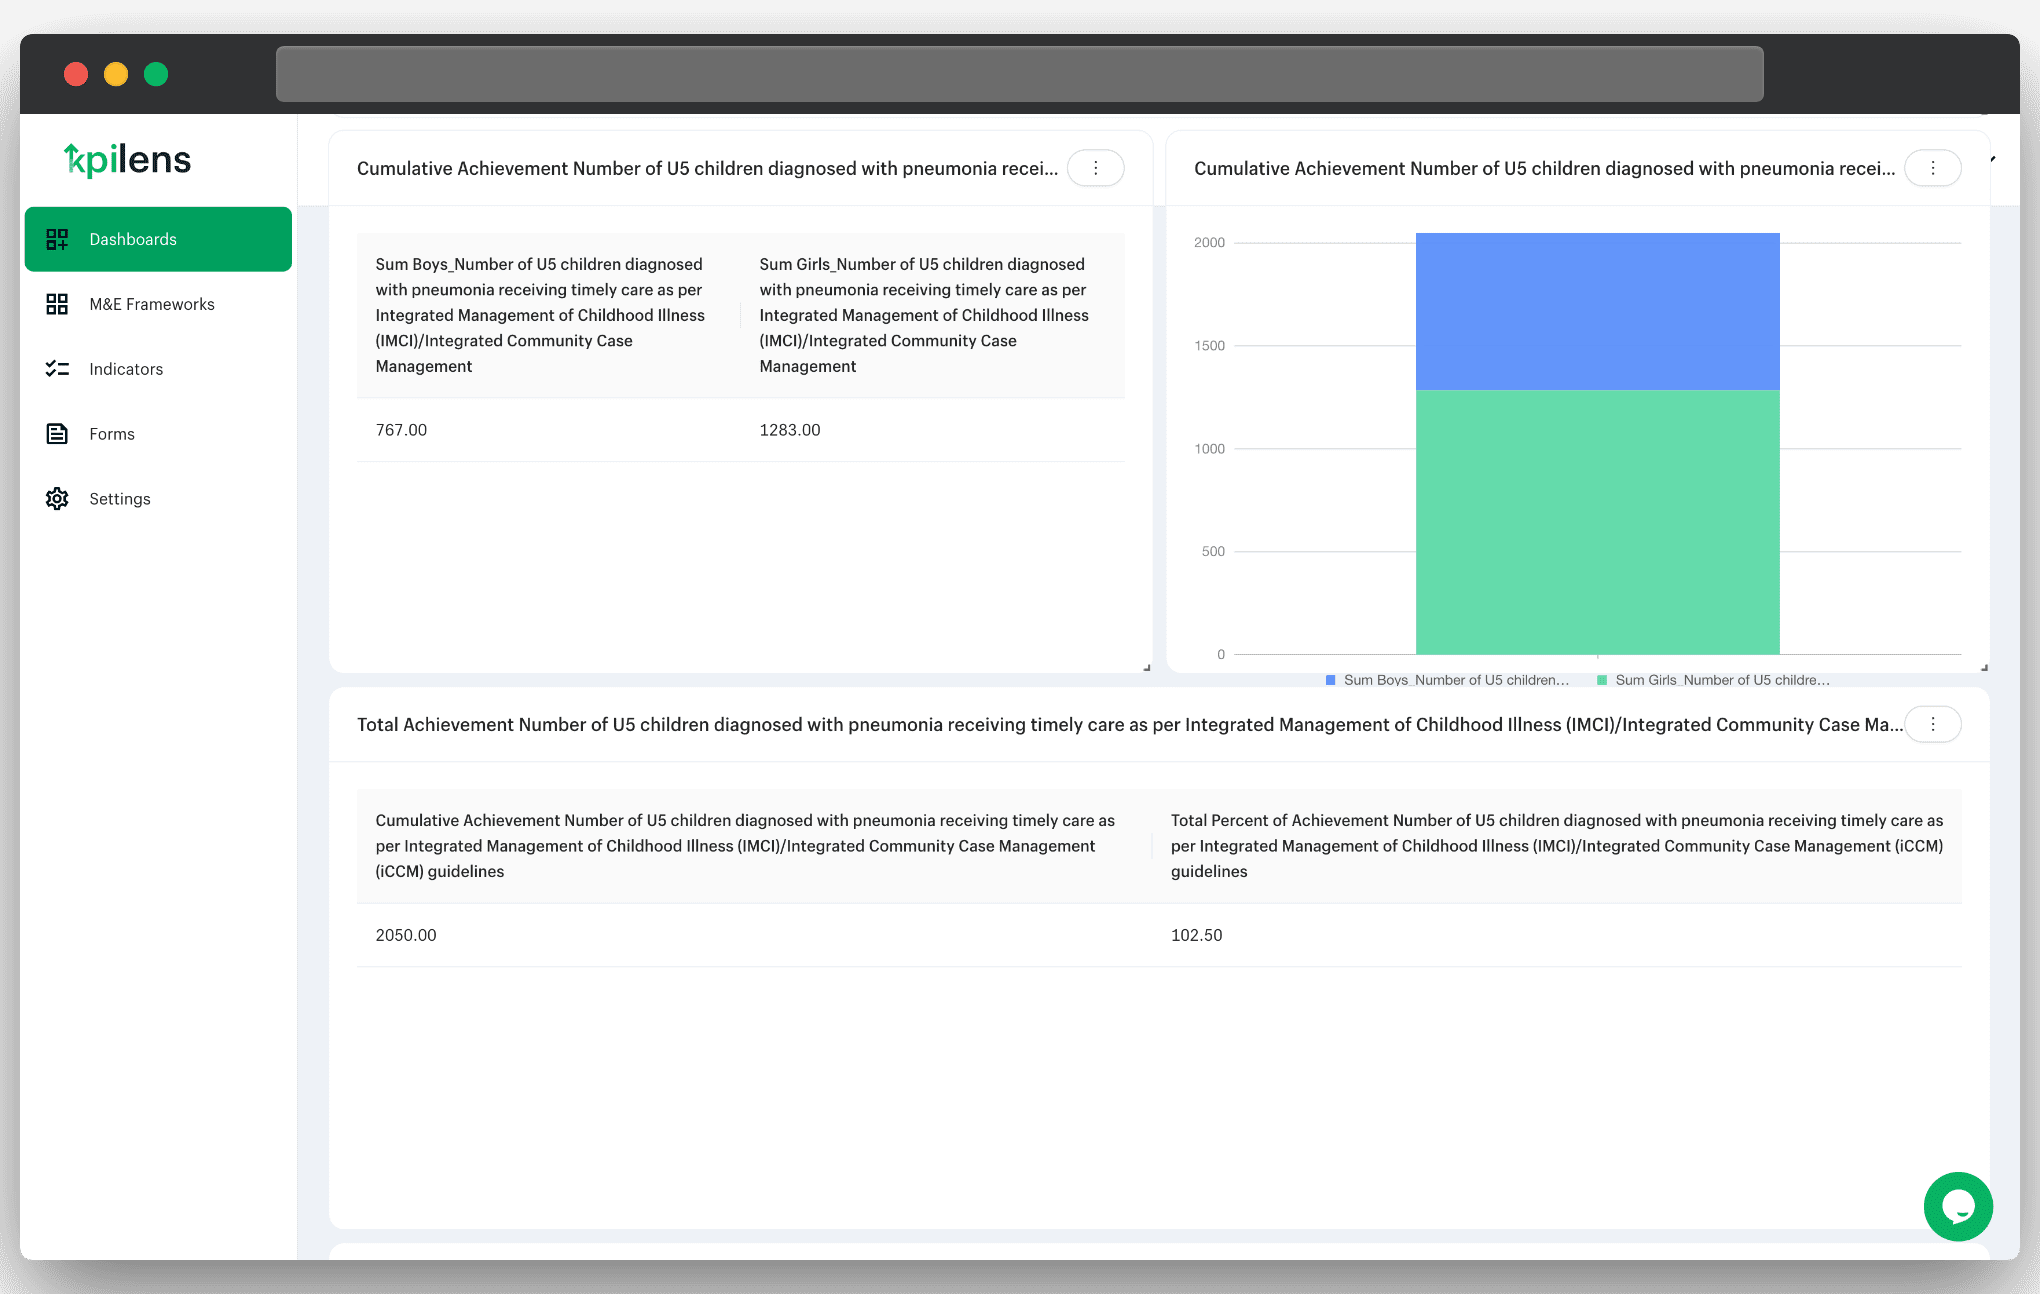
Project Dashboard
Each project has a dashboard that displays all dashboard widgets added from the indicator query builder. These dashboard items represent the visualisations of indicator results. They are updated with every data submitted through surveys in near real-time and can be shared with other stakeholders.
Project Assumptions and Goals
The project was created with the following assumptions:
- Data collection processes for M&E teams on the field are labour intensive because the M&E team has to constantly be in the field to collect data.
- Most M&E managers have a social sciences background yet majority of available M&E tools favour some level of knowledge in data science, hence, are not user-friendly.
- In the 3-tier experience map of the M&E process, data transformation has 9 steps, and is the most painful and frustrating part of the process.
The goal of the project is to sensitise executives on the potential funding from improved donor relations and reduced M&E costs that result from using KPI Lens; an all-in-one cloud-based platform where data can be collected, analysed and compared to a results framework to generate reports on dashboards that donors can access to see how a project is performing in near real-time, all while requiring no technical background to be able to use.
Stack Decisions
Language
JavaScript and TypeScript were chosen simply because they were what I knew very well at the time. I would make a different choice with what I know now.
Libraries and Frameworks
NestJS
NestJS' qualities include its Object Oriented Programming(OOP) coupled with an easy to use Dependency Injection(DI) system, first-class TypeScript Support, and a CLI amongst others. But what makes it stand out among other Node.js server-side application frameworks is its architecture. Nest provides an out-of-the-box application architecture which allows developers and teams to create highly testable, scalable, loosely coupled, and easily maintainable applications. I chose it for this project because of the following reasons:
- Multi-tenancy support: It was the only framework in which a multi-tenant architecture could be setup and implemented with relative ease compared to other frameworks. Multi-tenancy helped to segregate user data such that all workspaces had different databases.
- Plays nice with TypeORM: TypeORM is arguably one of the most mature open-source TypeScript ORMs out there and has an OOP paradigm that fits well with NestJS. It is very difficult to find libraries that play so nicely with frameworks as is the experience when using NestJS and TypeORM. It's almost as if one was designed with the other in mind. The ease this brings when modelling and querying data is unmatched.
- Code first GraphQL: When I first began using GraphQL, I created GraphQL Schema by writing GraphQL SDL by hand. At the time I thought to myself: "do all developers edit the same GraphQL schema of an app the size of say Facebook? That can't scale right?...". When I first saw the code first approach of using TypeScript decorators to generate GraphQL SDL from TypeScript class definitions, I knew my intuition was right. This was the way it had to be done in large apps.
- Microservices: NestJS abstracts away a lot of the complexity when dealing with microservices very well. It would have been very difficult to try to implement 3 backend services that talk to each other outside of using NestJS.
- Automated Open API(Swagger) docs generation: You can configure NestJS in just a few steps such that, comments written in your code become Open API documentation. How cool is that?
- REST and GraphQL APIs in one app: You can easily create both RESTful and GraphQL APIs in the same NestJS application. This helped me take advantage of the strengths of both paradigms on the frontend.
- Jest: There's almost no additional setup required to use Jest for testing in NestJS.
Next.js
Next.js was chosen primarily because it was the most mature React Framework at the time of building the application. It also pioneered server-side rendered React which the app benefited from by performing some operations on the server as opposed to the client for some performance gains.
GraphQL
For a data intensive app such as KPI Lens, GraphQL's safety and precision helps to avoid over-fetching and under-fetching of data needed to create a robust and performant experience.
Redux
Redux was needed to manage global application state when creating a dynamic survey.
Challenges and Thought Process
My biggest challenge was that I did not create an app of the size and complexity prior to KPI Lens. This combined with a fast-paced startup environment forced me to think on my feed and make decisions on the fly. I also had to learn almost all of the stack I've mentioned on the job; not having used them before. Like many developers my background was in PHP so the only required technology I knew was ES5 JavaScript coming into the project.
Figuring out multi-tenancy was very challenging. I had to understand the concept of multi-tenancy first even before I learned how to implement it in a framework that was new to me. Since the benefits were enormous for the project, I found a way.
The survey builder was complex to build. It involved building a schema while the user interacted with the UI and transforming that schema into a form. The same schema is used on the cubejs server to model the database. All survey data for a workspace are saved in an ETL table. However, each form when created, emitted an async event via the NATS message broker to a service which created a PostgreSQL View ready to compute data. I believe it brought forth some of my best engineering work till date. I had to dig in to find unusual ways of solving a problem which really stretched my understand of JavaScript, Node.js and all the other tools I use.
The indicator query builder seemed impossible in the beginning. It involved finding a way to allow users to query the database without writing SQL. This is because the goal of the app was to make it easy for non-technical M&E people to ask questions and gain insight from their data. Cubejs made it relatively easier to accomplish this. Using the same schema-based mindset, a schema is dynamically generated that serves as the semantic query layer for the database.
Lessons
There are numerous lessons I learned both from maturing as an engineer, and working in a fast-paced startup environment that I cannot fit into mere paragraphs. Only a book can do them justice. I will share a few regardless.
This is the first real-world product with real customers I built coming off the back of my self-taught software engineering journey.. It demanded a lot from me but I rose up to the challenge, and I learned a lot. Among these lessons are my deeper understanding of React.js and client state management. I also learned the tradeoffs between: building microservices and a monolith, using a monorepo tool or managing separate repos, REST and GraphQL, client-side rendering and server-side rendering, client state and server state, unit tests and integration/end-to-end tests, smart code and readable code, etc.
At first, just for the thrill of building like Google, we used Nx monorepo tool. However there were only two frontend apps so it didn't quite make sense to put them in a monorepo. Also, setting up a build pipeline outside of Nx cloud was a herculian task which we managed to pull off but there were numerous issues that resulted from it. This hurt our speed of delivery since I've had to be in a constant battle with the tools I'm using instead of focusing on shipping features and fixing bugs. Eventually I split the apps into separate repositories. The lesson here is that, as a startup, there's no gain in trying to build like Google(wink wink, do as I say not as I do). The only advantage a startup has is speed of delivery. Anything or anyone that impedes this speed should be removed.